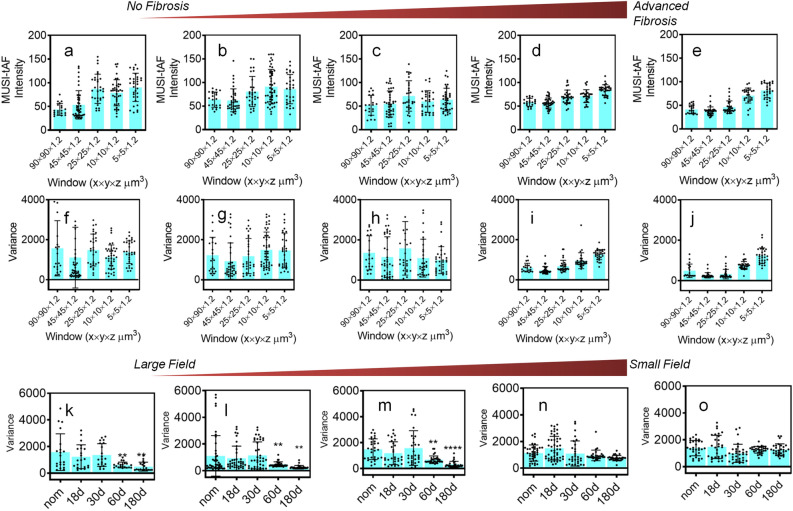
Figure 7.
Multi-scale evaluation of pathological fibrosis and wound scars with MUSI-tAF in mouse skin. MUSI-tAF measurement of (a–e) intensities and (f–j) variance in different window sizes; (a,f) healthy skin, (b,g) 18-day fibrosis, (c,h) 30-day fibrosis (d,i) 60-day fibrosis, and (e,j) 180-day fibrosis. N = 20–40 (N = 4 animals 10 ROI) per group. (k–o) Shows variance measurements between fibrotic stages, with window sizes (k) , (l) , (m) , (n) , (o) . N = 20 (N = 4 animals 5 ROI) per group. All plots (a–o) are represented as mean () ± standard deviation (SD) using error bars. Significant differences are marked with * for p 0.05, ** for p 0.01, *** for p 0.001, **** for p 0.0001. For statistical analysis, we used one-way ANOVA (95% confidence interval). Only the groups showing significant differences are labelled. The non-significant differences are not labeled. The statistical comparisons are made only with respect to the controls (first column). Significant changes were found in images (k) to (m).

