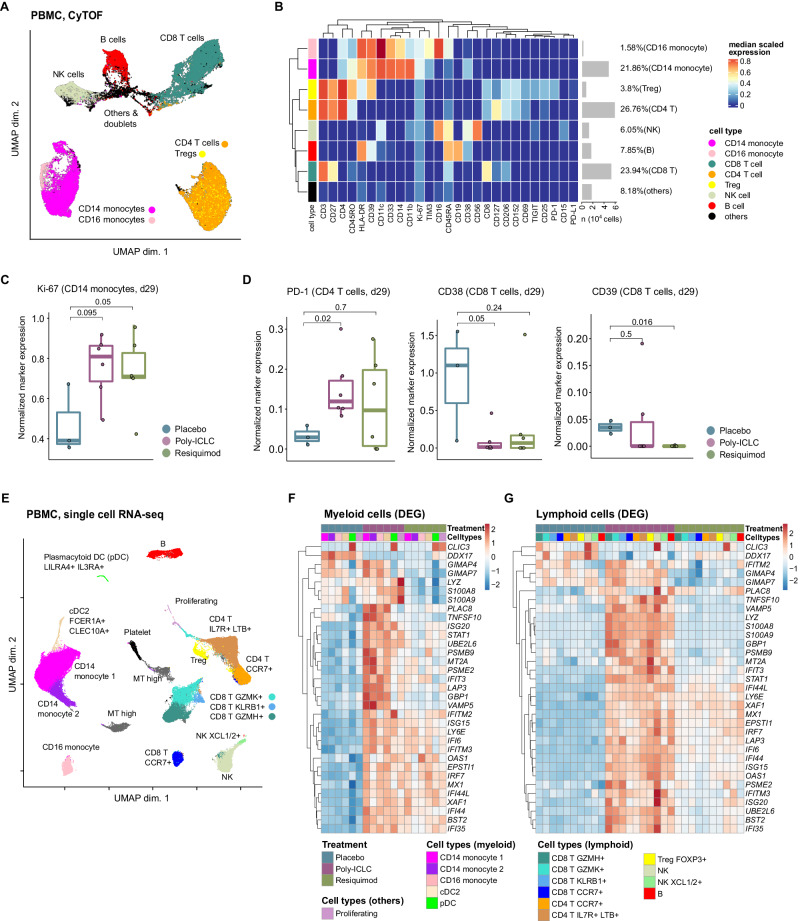
Fig. 2. Single cell analysis reveals activation of systemic T cells and monocytes as a part of interferon pathway activation in all myeloid and lymphoid populations.
A A UMAP projection of the pre- and post-treatment PBMC sample pairs from twenty patients (placebo, n = 4 pairs; poly-ICLC, n = 9 pairs; resiquimod, n = 7 pairs). Clustering was performed with a random sampling of 5,000 cells from each patient. B Heatmap of normalized expression of all 27 cell markers within cell populations identified in the patient PBMCs. C, D Normalized expression of indicated markers in monocyte (C), or T cell populations (D) within the PBMC samples of patients from indicated treatment groups. P values, two-sided Wilcoxon rank sum test. E, UMAP projection of the PBMC-derived single cells (n = 99,590). The immune subset associated with each cluster is inferred based on the cluster’s differentially expressed transcripts. Canonical markers of known immune subsets are shown. F, G Heatmaps showing the union of recurrent DEGs computed between ATL-DC treated samples (combined with placebo, resiquimod or poly-ICLC) and pre-treatment samples in the myeloid populations (F) or lymphocyte populations (G). Shown in the heatmaps are the log fold change values of the DEGs in each cell population grouped by their treatment groups. The number of sample pairs analyzed in C and D are: ATL-DC+placebo, 4 pairs; ATL-DC+poly-ICLC, 9 pairs; ATL-DC+resiquimod, 7 pairs. The rectangular box in each boxplot represents the interquartile range (IQR), spanning from the first quartile (25th percentile, bottom of box) to the third quartile (75th percentile the top of box). Inside the box, the median (50th percentile) is marked. The whiskers (shown as lines extending from the box) extend to the largest and smallest non-outlier values within 1.5 times the IQR, while outliers lie beyond the whiskers.

