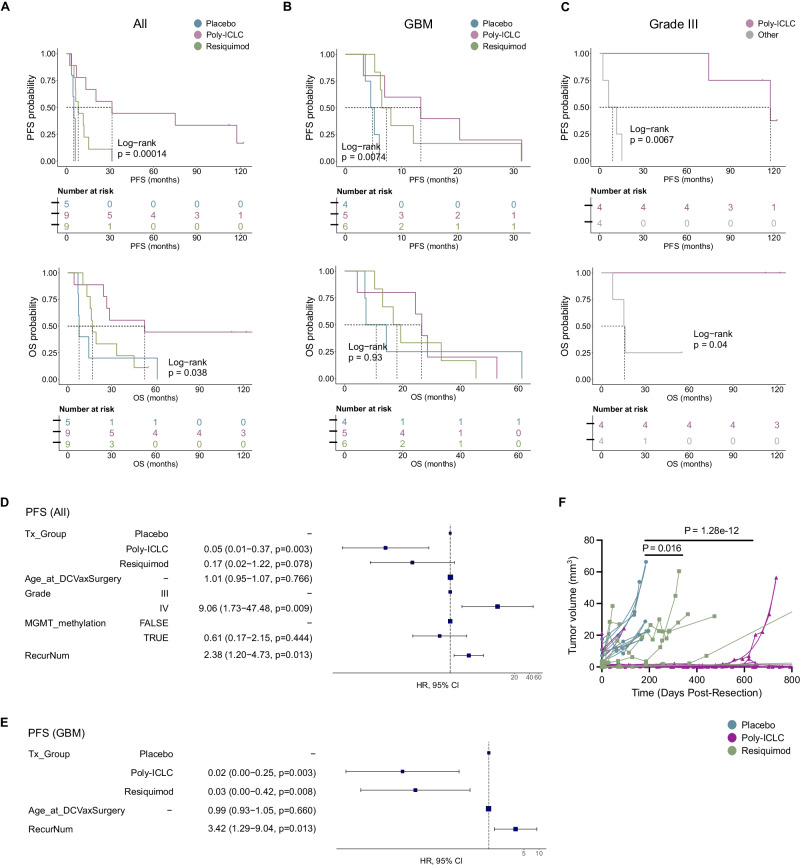
Fig. 3. Combined ATL-DC vaccine and TLR agonist treatment show trends of improved tumor control and patient survival.
A–C Progression-free survival (PFS, top) and overall survival (OS, bottom) of all patients (A), patient subset with GBM (B), or grade III glioma (C) in indicated treatment groups. P values, log-rank test. D, E, Multivariate Cox proportional hazards analysis assessing the hazard ratios of tumor progression in TLR agonist treatment groups against placebo in all patients (D) or GBM subset (E) after adjusting for other clinical covariates (Tx_Group=treatment group, RecurNum=number of recurrences prior to ATL-DC treatment). In the forest plot, the squares are the hazard ratio (HR) estimates, the error bars are 95% confidence interval (CI) of the HR, the P value of each covariate is based on its Wald statistics, the P values are not adjusted. In D, the sample distribution in each covariate is Tx_Group: placebo=5, poly-ICLC = 9, resiquimod=9; Grade: III = 8, IV = 15; MGMT_methylation: True=8, False=15. In E, Tx_Group: placebo=4, poly-ICLC = 5, resiquimod=6. F, MR-computed volumes of post-treatment, recurrent tumors in indicated treatment groups. Treatment groups: Placebo (n = 5), Resiquimod (n = 8); Poly ICLC (n = 9). P values, unpaired, two-sided Wilcoxon rank sum test.

