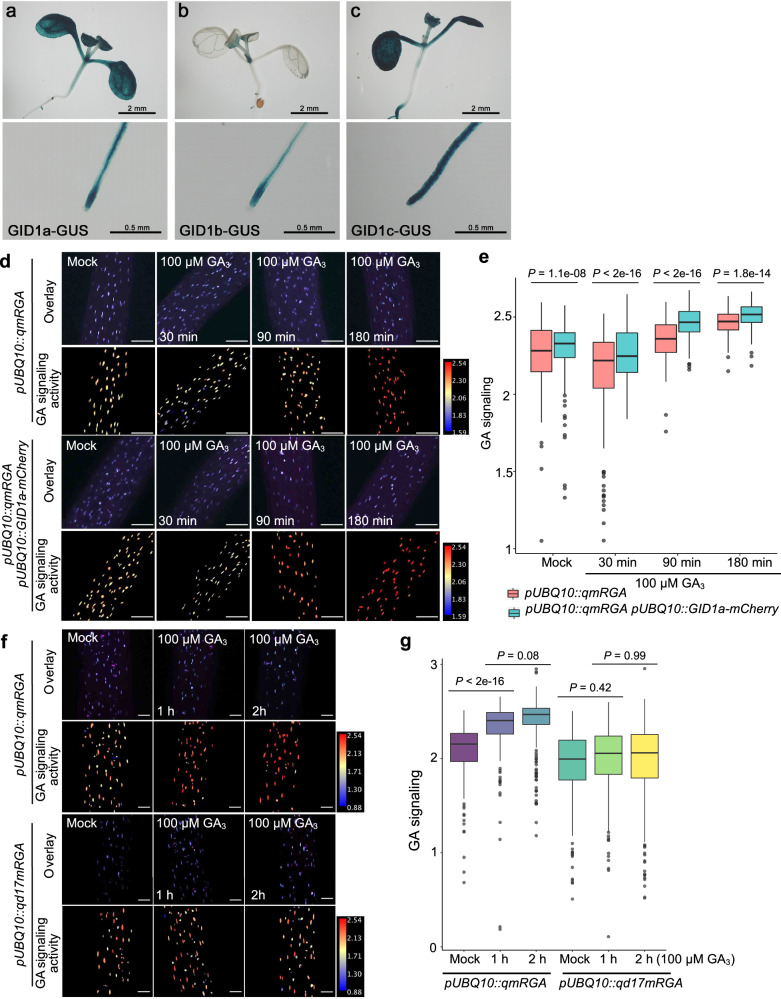
Fig. 3. The qmRGA sensor signal depends on GA receptor activity.
a–c Expression pattern of GID1a, GID1b and GID1c in shoots (upper panel) and root tips (lower panel) of 7-day-old pGID1a::GID1a-GUS (a), pGID1b::GID1b-GUS (b) and pGID1c:: GID1c-GUS (c) seedlings. d, f Overlay of VENUS and TagBFP maximum intensity projection (upper row), and corresponding heatmap representation of GA signaling activity (lower row) in hypocotyls of 5-day-old pUBQ10::qmRGA and pUBQ10::qmRGA pUBQ10::GID1a-mCherry seedlings treated with 100 μM GA3 for 30, 9,0 and 180 min (d), and of pUBQ10::qmRGA and pUBQ10::qd17mRGA seedlings treated with 100 μM GA3 for 1 and 2 h (f) and mock controls. e Boxplot representation of GA signaling activity (Mock, n = 65 nuclei examined over three independent seedlings; 100 µM GA3 for 30 min, n = 163 nuclei examined over four independent seedlings; 90 min, n = 129 nuclei examined over three independent seedlings; 180 min, n = 142 nuclei examined over three independent seedlings) measured in pUBQ10::qmRGA seedling hypocotyls, and (Mock, n = 150 nuclei examined over four independent seedlings; 100 µM GA3 for 30 min, n = 182 nuclei examined over four independent seedlings; 90 min, n = 251 nuclei examined over five independent seedlings; 180 min, n = 101 nuclei examined over three independent seedlings) measured in pUBQ10::qmRGA pUBQ10::qmRGA pUBQ10::GID1a-mCherry seedling hypocotyls grown in the same conditions as in (d), indicated by different colors. Center lines show the medians and box limits indicate the 25th and 75th percentiles. Whiskers indicate minima and maxima as determined using the R software. P-values are from Kruskal–Wallis tests. The experiment was repeated three times with similar results. g Boxplot representation of GA signaling activity (Mock, n = 332 nuclei examined over eight independent seedlings; 100 µM GA3 for 1 h, n = 329 nuclei examined over seven independent seedlings; 2 h, n = 343 nuclei examined over seven independent seedlings) measured in pUBQ10::qmRGA seedling hypocotyls, and (Mock, n = 293 nuclei examined over nine independent seedlings; 100 µM GA3 for 1 h, n = 421 nuclei examined over ten independent seedlings; 2 h, n = 343 nuclei examined over ten independent seedlings) measured in pUBQ10::qd17mRGA seedling hypocotyls grown in the same conditions as in (f), indicated by different colors. Center lines show the medians and box limits indicate the 25th and 75th percentiles. Whiskers indicate minima and maxima as determined using the R software. P-values are from Kruskal–Wallis tests. The experiment was repeated twice with similar results. Scale bars = 100 µm.

