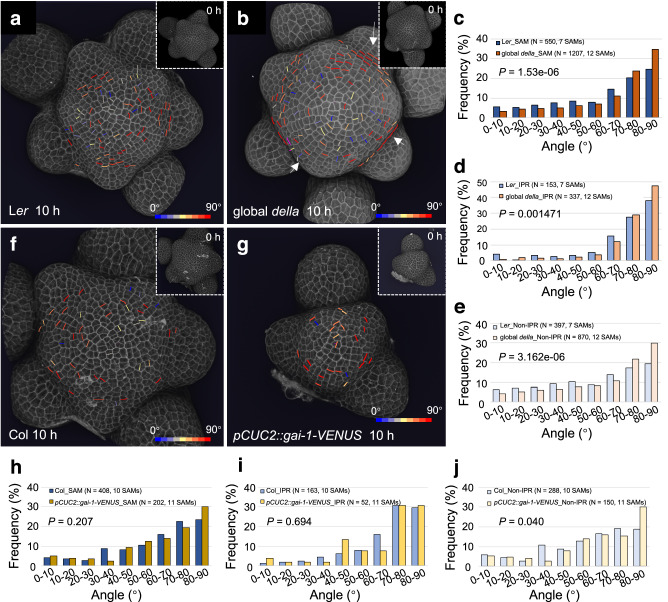
Fig. 6. Cell division orientation distribution in the SAM is modified in global della mutants and pCUC2::gai-1-VENUS transgenic plants.
a, b 3D visualization of the L1 layer of PI-stained Ler (a) and global della mutant (b) SAM using confocal microscopy. New cell walls formed in the SAM (but not primordia) in 10 h are shown and colored according to their angle values. Inserts show the SAM at 0 h. The color bars are shown in the bottom-right corners. Arrows in (b) highlight examples of aligned cell files in global della mutant. The experiment was repeated twice with similar results. c–e Comparison of the frequency distribution of division plane orientation of cells in the entire SAM (d), IPR (e), and non-IPR (f) between Ler and global della. P-values are from two-sided Kolmogorov–Smirnov tests. f, g 3D visualization of confocal image stacks of PI-stained SAMs of Col-0 (i) and pCUC2::gai-1-VENUS (j) transgenic plants. New cell walls formed in the SAM (but not primordia) in 10 h are shown as in (a, b). The experiment was repeated twice with similar results. h–j Comparison of the frequency distribution of division plane orientation of cells located in the entire SAM (h), IPR (i), and non-IPR (j) between Col-0 and pCUC2::gai-1-VENUS plants. P-values are from two-sided Kolmogorov–Smirnov tests.

