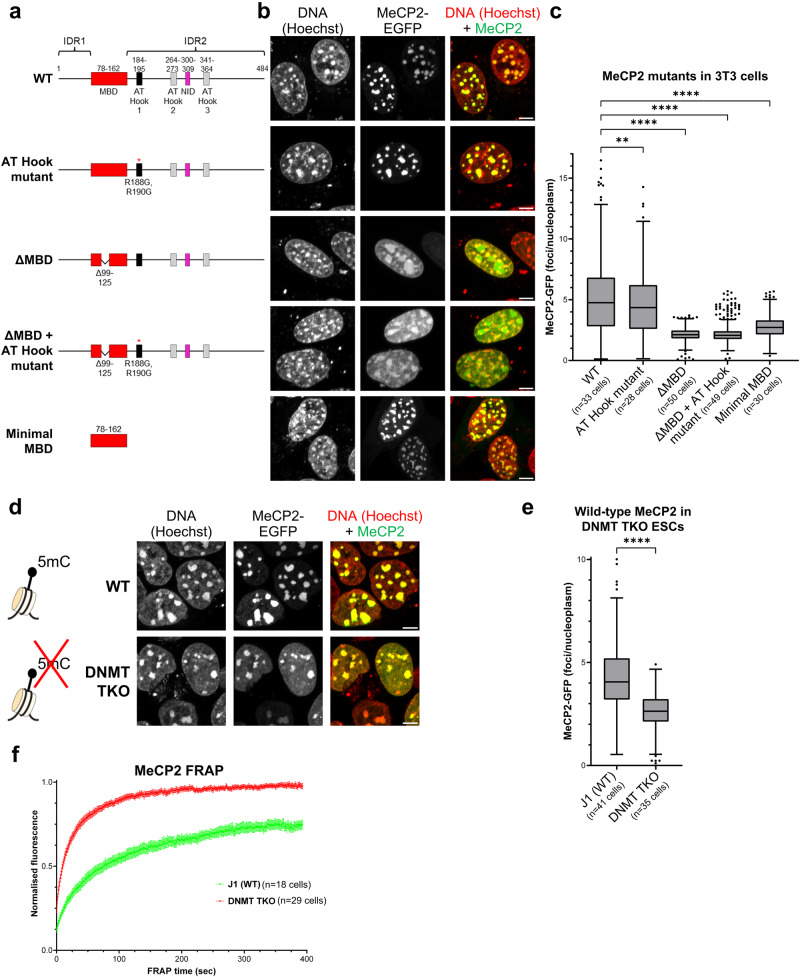
Fig. 1. MeCP2 localises to DNA-dense foci in mouse cells via its Methyl-DNA Binding Domain (MBD).
a Diagram showing the structure of wild-type and mutant MeCP2 constructs (fused with EGFP) used for live-cell imaging with annotated domains. MBD methyl-CpG binding domain, NID NCoR-interaction domain, IDR intrinsically disordered region. b Live-cell imaging of 3T3 cells transfected with the EGFP-MeCP2 constructs indicated in (a). Hoechst staining was used to visualise DNA. Scale bars: 5 µm. c Box plot showing the quantification of MeCP2 wild-type and mutant fluorescence at DNA-dense foci (relative to nucleoplasm) in 3T3 cells, as described in (b). The box lower and upper limits correspond to the 25th and 75th percentiles, respectively, with the centre line corresponding to the median. Whiskers extend up to 1.5 times the interquartile distance according to Tukey’s method, and individual points are outliers. The number of analysed cells from two independent experiments are: WT n = 33 cells, AT-Hook mutant n = 28 cells, ΔMBD n = 50 cells, ΔMBD + AT-Hook mutant n = 49 cells, Minimal MBD n = 30 cells. Stars indicate statistical significance compared to wild-type MeCP2 (Brown-Forsythe and Welch ANOVA test). d Live-cell imaging of wild-type (J1) and DNMT TKO ESCs transfected with wild-type EGFP-MeCP2. Hoechst staining was used to visualise DNA. Scale bars: 5 µm. Diagram adapted from Lyst and Bird, Nat Rev Genet, 201519. e Box plot showing the quantification of MeCP2 fluorescence at DNA-dense foci (relative to nucleoplasm) in wild-type (J1) and DNMT TKO ESCs, as described in (d). The box lower and upper limits correspond to the 25th and 75th percentiles, respectively, with the centre line corresponding to the median. Whiskers extend up to 1.5 times the interquartile distance according to Tukey’s method, and individual points are outliers. The number of analysed cells from two independent experiments are: J1 (WT) n = 41 cells, DNMT TKO n = 35 cells. Stars indicate statistical significance compared to wild-type cells (two-tailed unpaired t test with Welch’s correction). f Graph showing the FRAP quantification of wild-type EGFP-MeCP2 in wild-type (J1, green) and DNMT TKO (red) ESCs. The number of analysed cells from two independent experiments are: J1 (WT) n = 18 cells, DNMT TKO n = 29 cells. Error bars: SEM.

