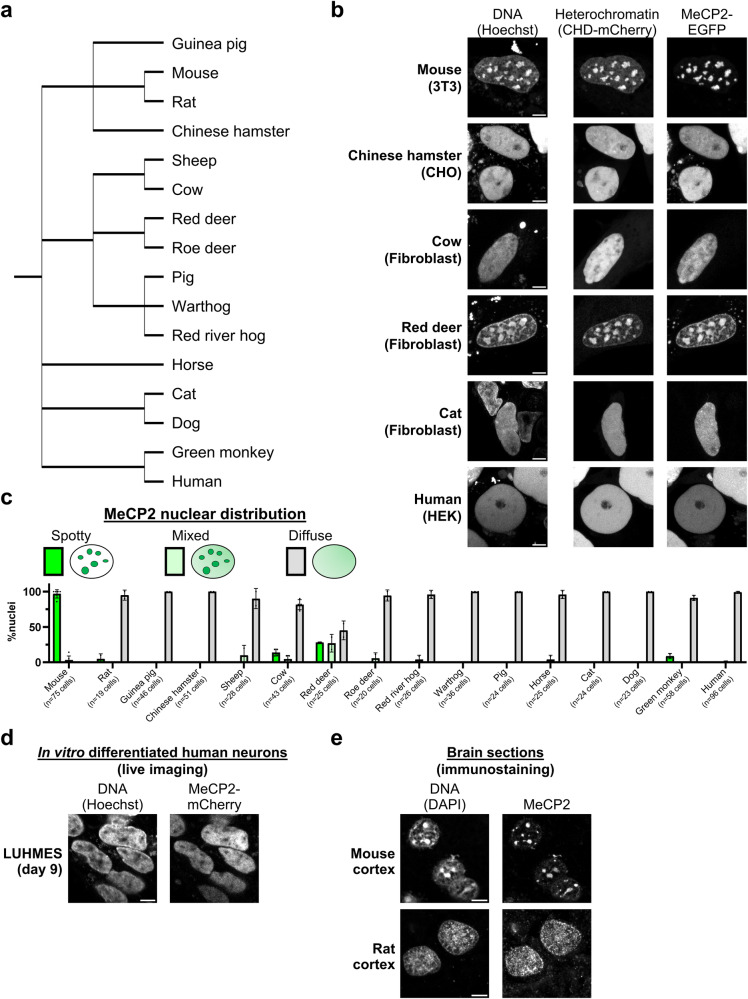
Fig. 3. MeCP2 displays a diffuse nuclear distribution in most mammalian species.
a Phylogenetic tree showing the mammalian species used in this study (from NCBI Taxonomy). b Live-cell imaging of the indicated mammalian cell lines transfected with wild-type EGFP-MeCP2. Hoechst staining and a CHD-mCherry reporter were used to visualise DNA and heterochromatin, respectively. Scale bars: 5 µm. c Graph showing quantification of MeCP2 nuclear distribution (spotty, mixed, diffuse) in all studied mammalian species, as described in (b) and Supplementary Fig. 6. The number of analysed cells from at least two independent experiments are: Mouse n = 75 cells, Rat n = 19 cells, Guinea pig n = 46 cells, Chinese hamster n = 51 cells, Sheep n = 28 cells, Cow n = 43 cells, Red deer n = 25 cells, Roe deer n = 20 cells, Red river hog n = 26 cells, Warthog n = 36 cells, Pig n = 24 cells, Horse n = 25 cells, Cat n = 24 cells, Dog n = 23 cells, Green monkey n = 58 cells, Human n = 96 cells. Data are presented as mean values ± SD. d Live-cell imaging of human postmitotic neurons (LUHMES cells) expressing endogenously tagged MeCP2-mCherry (representative images from two independent experiments). Hoechst staining was used to visualise DNA. Scale bar: 5 µm. e Immunofluorescence of endogenous MeCP2 in mouse and rat brain cortex (representative images from multiple sections in a single animal). DAPI staining was used to visualise DNA. Scale bars: 5 µm.

