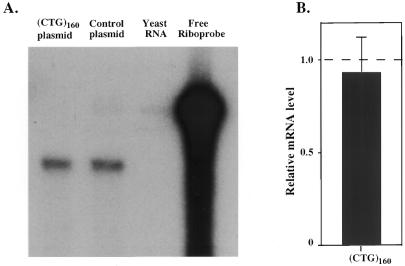
Figure 2.
Comparison of luciferase mRNA levels for the pGL2-Promoter and (CTG)160-containing plasmids. (A) Typical experimental data. (B) Statistical analysis of five independent experiments. RNA amounts were normalized to that for the control pGL2 plasmid. The dashed line shows the expression level for the control plasmid.

