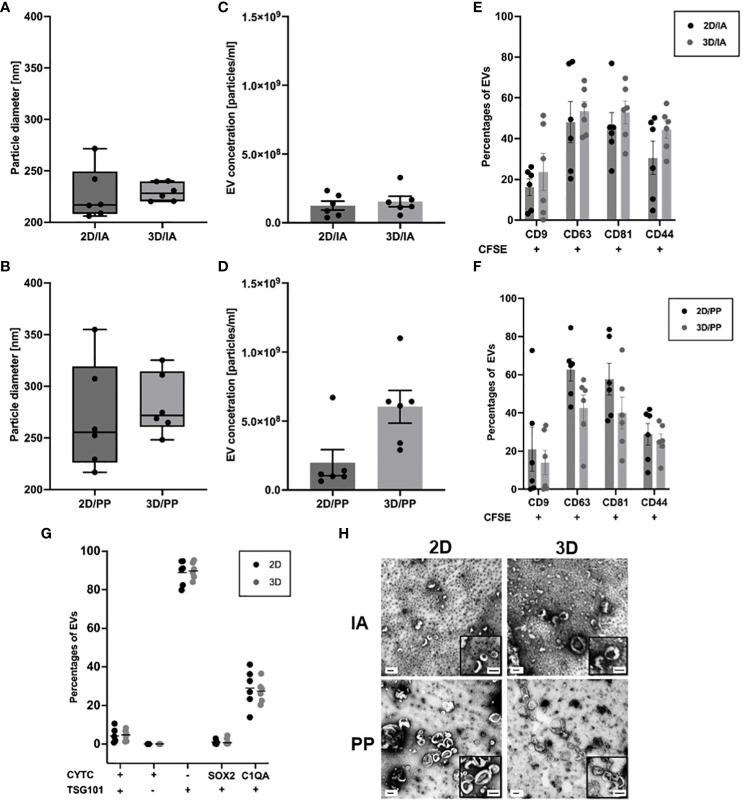
Figure 1.
EV characterisation in 3D organoids and corresponding 2D models. (A) Size measurements of purified EVs after IA and (B) PP from 2D and 3D cultures. Box-Whisker Plots of the median (line) (n=6). Concentration measurements of purified EVs after (C) IA and (D) PP from 2D and 3D cultures and corrected for sample dilution. Data are shown as mean ± SEM (n=6). (E) Surface– and bead-based flow cytometry: Percentages of CD81+, CD63+, CD9+, CD44+ EVs isolated by IA and (F) PP (n=6, multiple t-test). (G) Percentages of CYTC+,TSG101+, SOX2+,C1QA+ EVs isolated by PP. Data are shown as mean ± SEM (n=6, multiple t-test); (H) TEM images of purified EVs obtained from 2D and 3D. Images show wide-field and close-up views (bottom right box). Scale bars show 100 nm.

