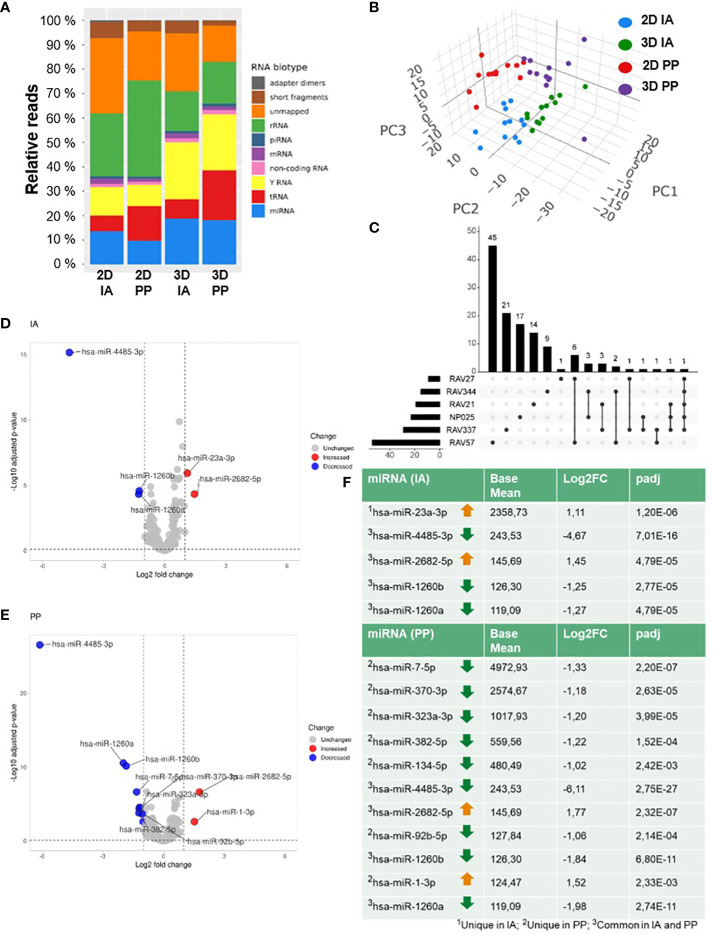
Figure 2.
SmallRNA-Seq of 2D and 3D GBM models. (A) Graphical representation of the distribution of RNA reads from SmallRNA-Seq aligning to different EVRNAs from 2D or 3D culture and after IA and PP isolation; (B) PCA of total analyzed samples (n=48). (C) UpSet Plot shows the pairwise comparison of 2D and 3D with the number of unique and common differentially regulated miRNAs in six GBM cell lines. (D) Volcano plots of differentially expressed EVmiRNAs after IA and (E) PP isolation. (F) DGE analysis: Table lists the numbers of differentially expressed miRNAs after IA and PP isolation (Filter criteria: Base mean ≥ 100; log2FC ≥ 1 or log2FC ≤ -1; padj ≤ 0.1).

