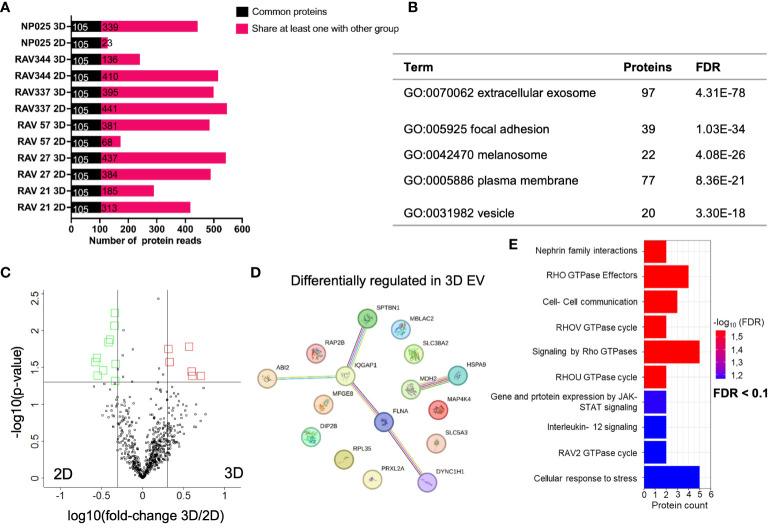
Figure 5.
Comparative proteome analysis of immunoaffinity purified EVs from six 3D versus 2D samples. (A) Number of proteins detected in 2D and 3D EV preparations in cell lines derived from six different patients (n=6). Common proteins across 12 samples are displayed in black, while shared proteins present in at least one group are indicated in pink. (B) TOP 5 GO terms from DAVID cellular component analysis (https://david.ncifcrf.gov/tools.jsp) using all 105 common proteins from 2D and 3D EVs. (C) Volcano plot showing differentially abundant proteins from 3D versus 2D cell culture medium. Black line represents significant cut offs (t-test p-value multiple testing corrected < 0.05; -2 > fold change 3D/2D < 2). Proteins highlighted in red were significantly higher concentrated in 3D EVs. Proteins highlighted in green were significantly higher concentrated in 2D EVs (D) Interaction analysis of up- and downregulated proteins in 3D using STRING database (string-db.org); The line color indicates the type of interaction evidence, with purple and light blue lines denoting known, experimentally validated or database-derived interactions and other colors defining predicted interactions. The line thickness indicates the strength of the data support. (E) Significant terms of the Reactome overrepresentation analysis of all significantly regulated proteins in 3D EVs.

