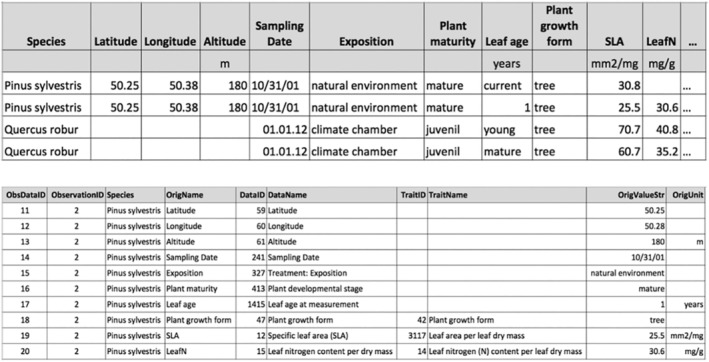
FIGURE 2.

(Top) Intuitive implementation of the OBOE schema in a two‐dimensional (2D) table, with observations in rows, and traits and ancillary data in columns. (Bottom) Demonstration of the long‐table format used within TRY data releases. The second observation (row) in the top panel is provided as an example. The data release provides the unique identifiers for each data record (‘ObsDataID’), and the observation (‘ObservationID’), the taxon of the entity, and identifiers, names, values, and units of trait records and ancillary data. Empty cells for ‘TraitID's indicate that the entry is an ancillary datum. For clarity, the number of columns has been reduced compared to TRY data releases.
