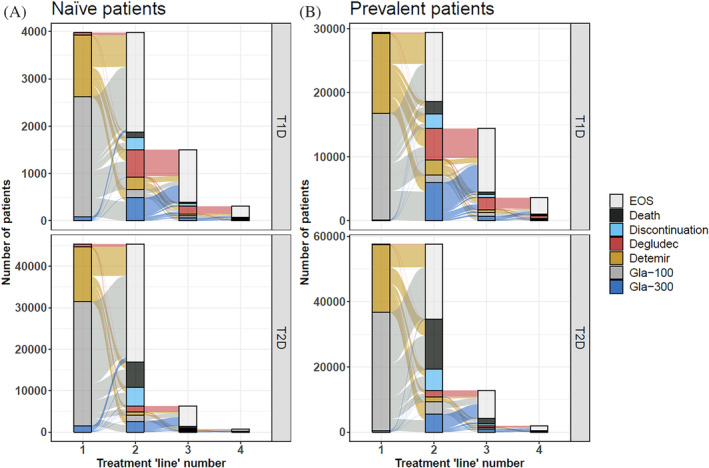
FIGURE 3.

Sankey plot of switches from one BI to another, BI discontinuation, EOS, or death in naïve users (left) and prevalent users (right). Top panels T1D, bottom panels T2D. Please note the scale difference for each panel. BI, basal insulin; EOS, end of study; Gla, glargine; T1D, type 1 diabetes; T2D, type 2 diabetes.
