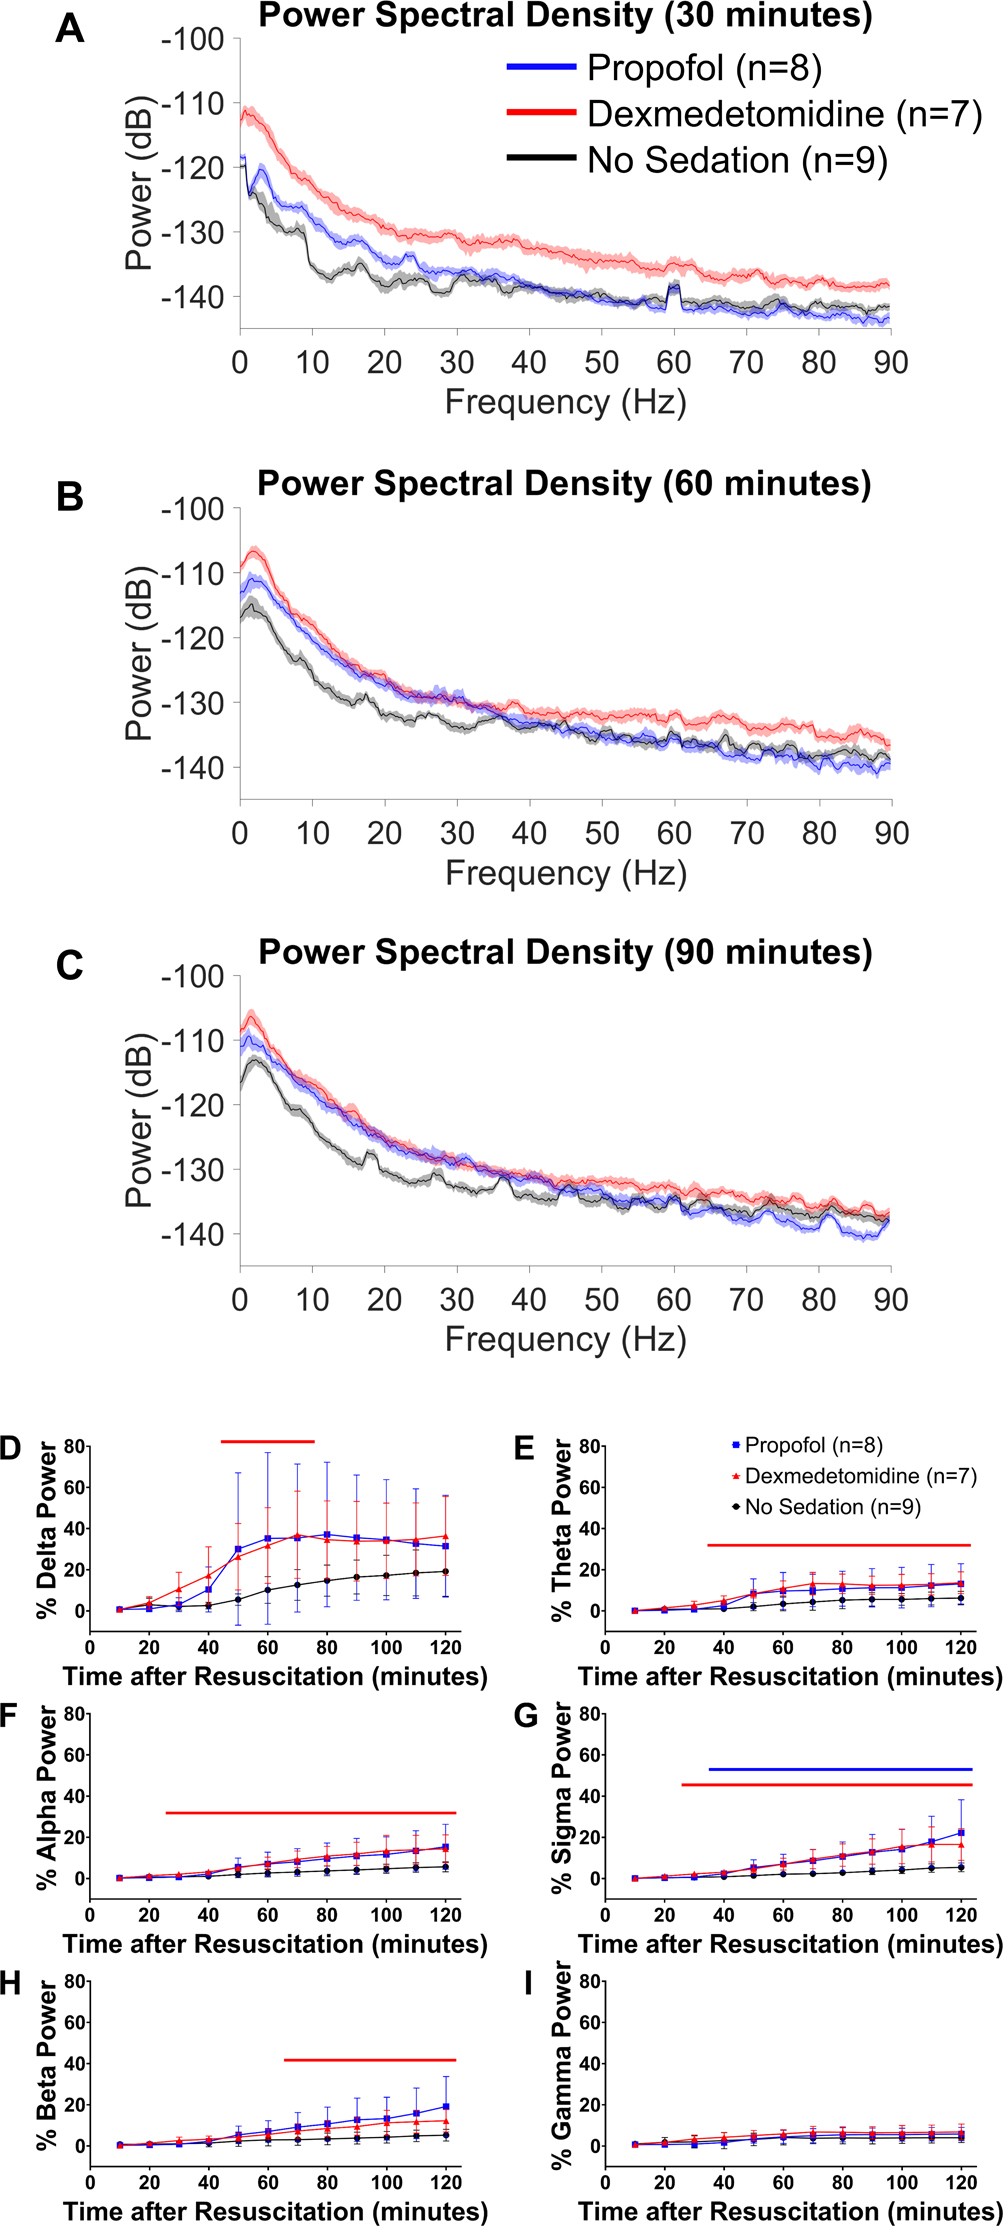
Figure 5.

Propofol- or dexmedetomidine-induced EEG changes during post-cardiac arrest sedation (0–2 hours after return of spontaneous circulation). Power spectral density at (A) 30, (B) 60, and (C) 90 minutes after return of spontaneous circulation in male and female mice without sedation and those sedated with propofol at 40 mg η kg−1 η h−1 or dexmedetomidine at 1 μg η kg−1 η h−1 starting at return of spontaneous circulation. The median and 95% confidence intervals of spectral density are displayed. Changes in (D) delta, (E) theta, (F) alpha, (G) sigma, (H) beta, and (I) gamma power in the first 120 minutes after resuscitation. EEG power was calculated for each frequency band at consecutive 10-minute time blocks, which was expressed as percent of the baseline EEG power before cardiac arrest. Data are presented as mean ± SD. The P-values for the interaction effect [group × time] are summarized in Supplementary Table 4. The colored lines in each graph indicate statistically significant differences from the no sedation group at specific time points after resuscitation (P < 0.05; blue: propofol vs. no sedation, red: dexmedetomidine vs. no sedation; Dunnett’s test).
