
Figure 7.
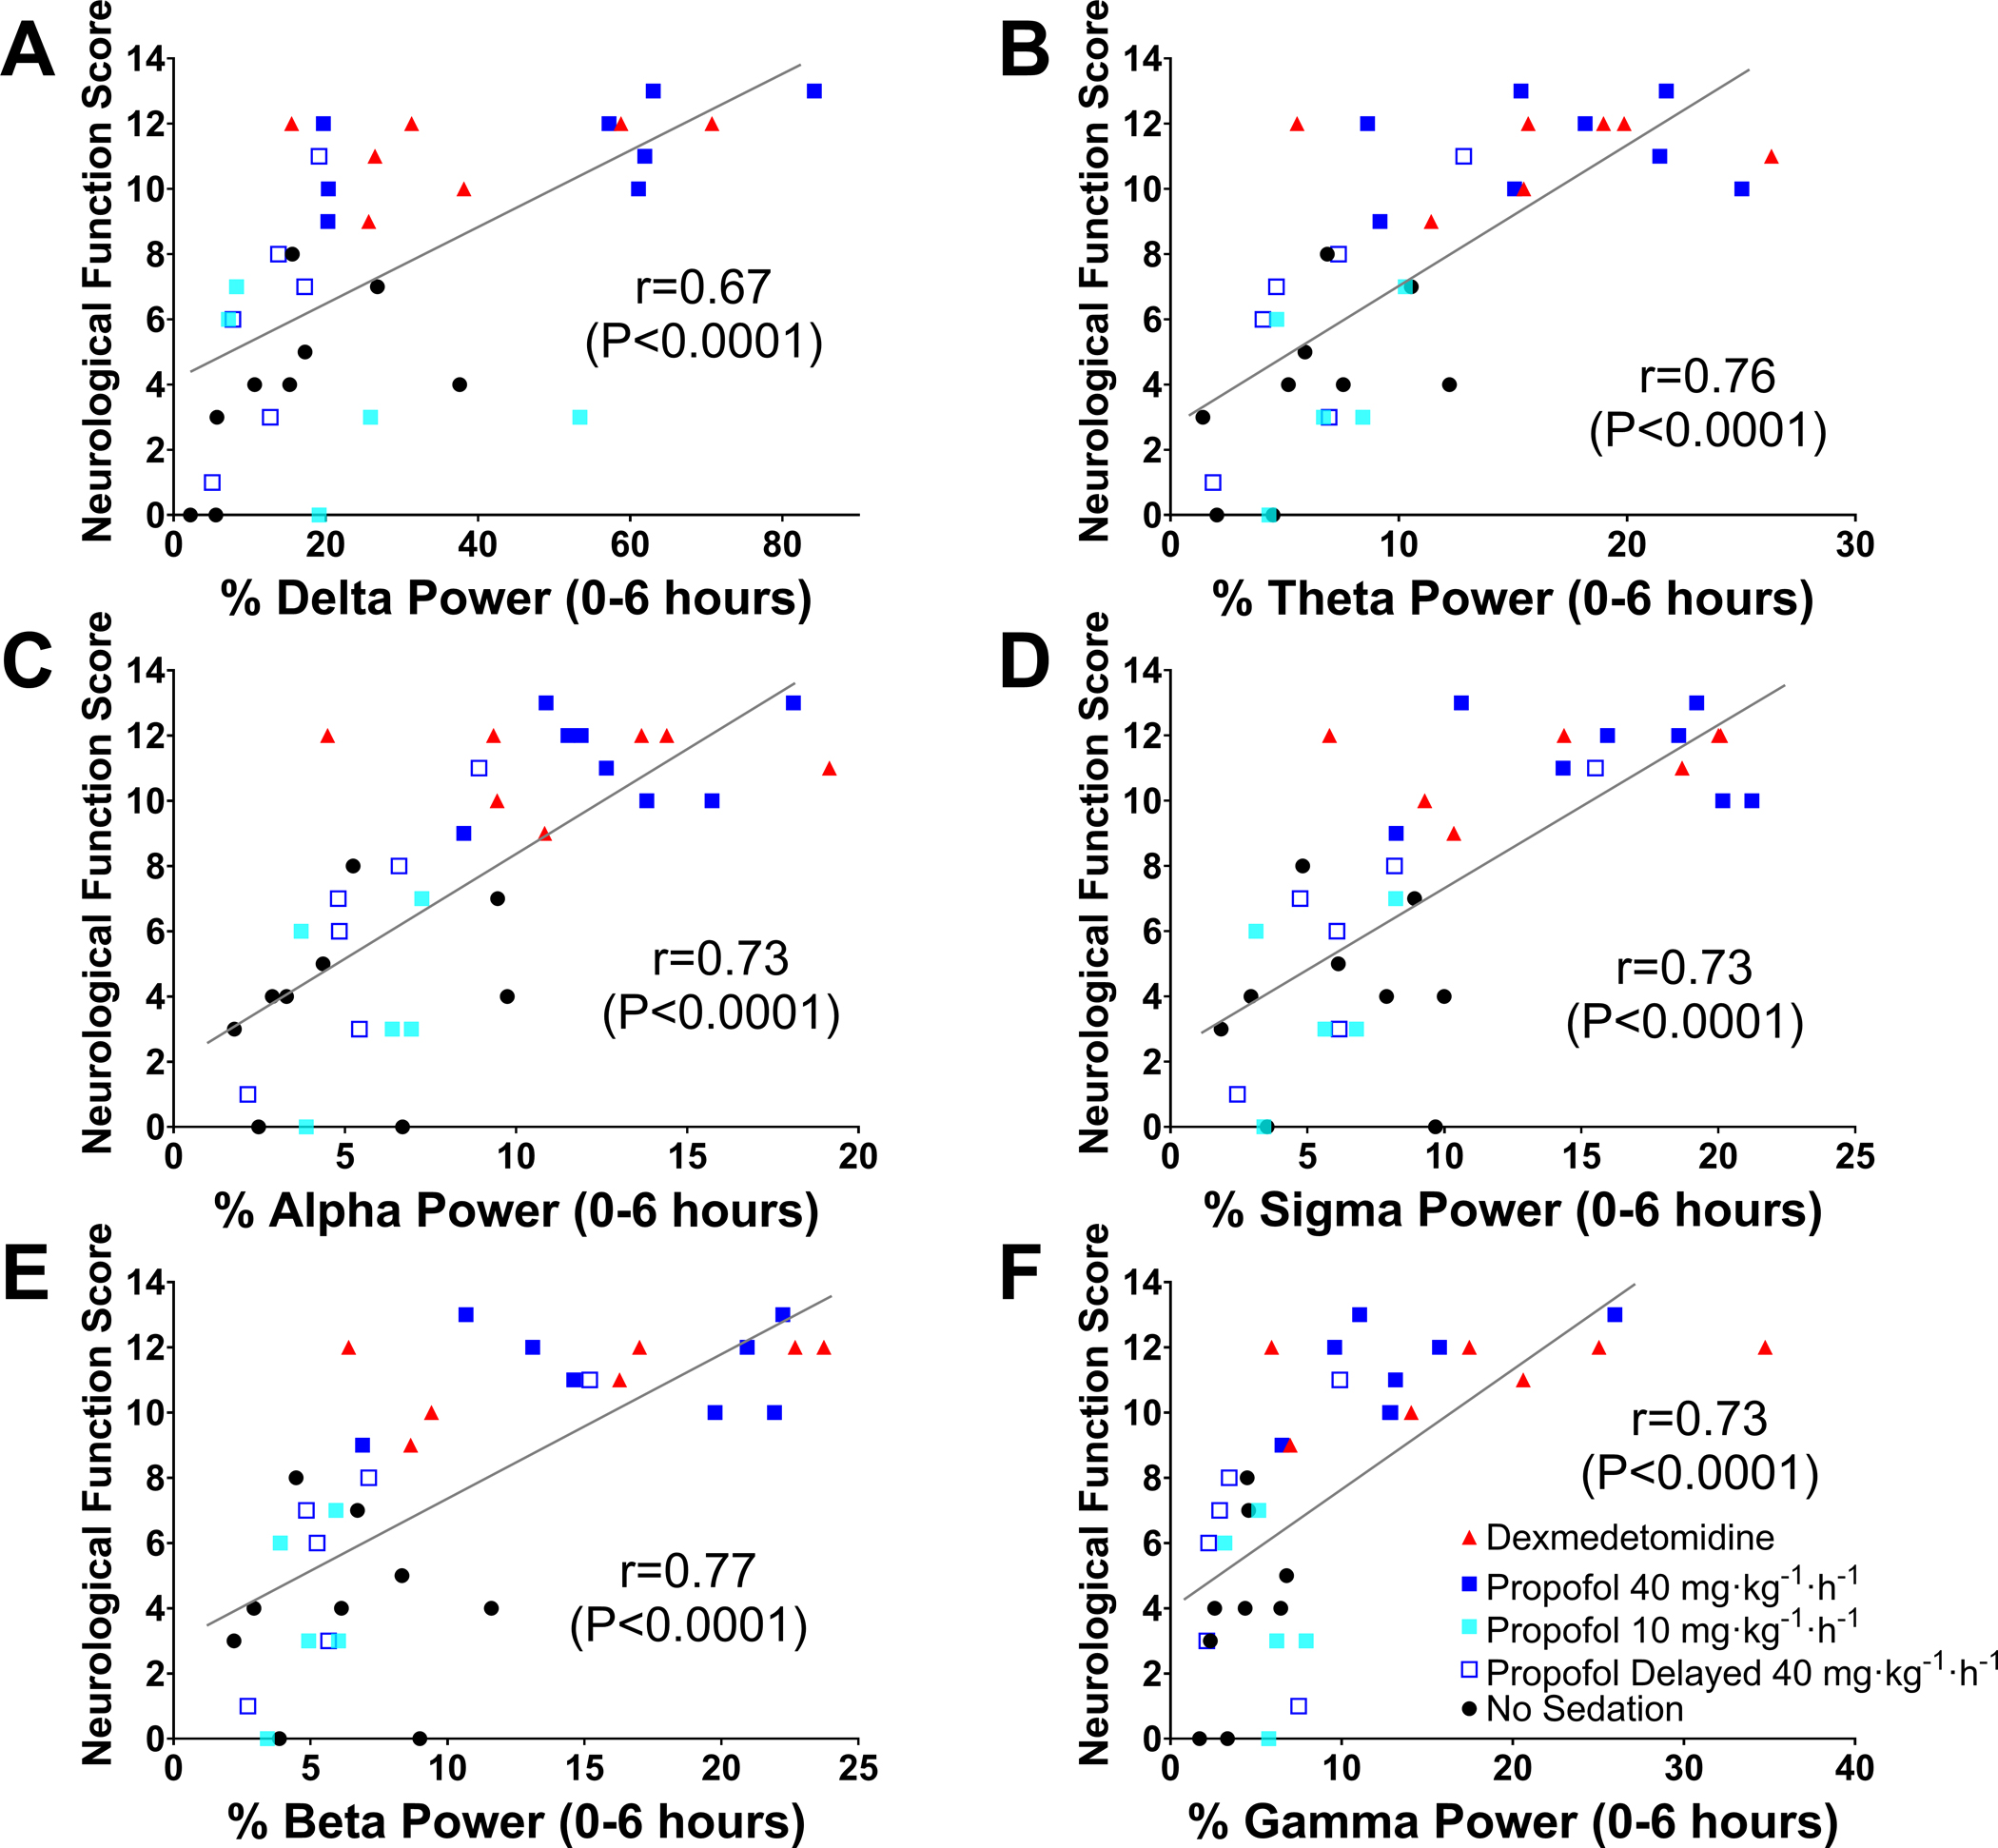
Relationship between EEG power early after resuscitation and neurological function at 24 hours post-cardiac arrest in male and female mice. The horizontal axis represents the relative EEG power in (A) delta, (B) theta, (C) alpha, (D) sigma, (E) beta, and (F) gamma frequencies in the first 6 hours after return of spontaneous circulation, and the vertical axis represents the neurological function scores at 24 hours post-cardiac arrest that were assessed using the Scale 2. The Spearman correlation coefficient is reported. Note that dead mice were included in the analysis.