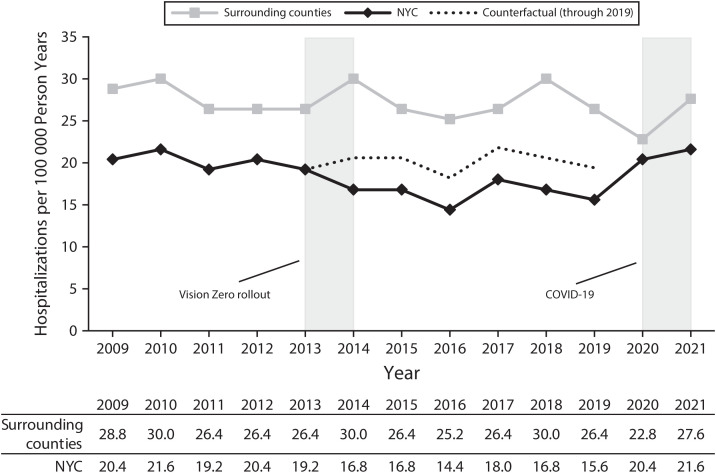
FIGURE 2—
Adjusted Annual Traffic-Related Hospitalization Rate Among Medicaid Enrollees in New York City (NYC) vs Surrounding Counties: 2009–2021
Note. Rates are adjusted for individual age, race/ethnicity, and gender in a Poisson model with an offset term for enrolled months. The counterfactual line is estimated from the difference-in-differences (DID) regression model described in the Statistical Analyses section: in the absence of Vision Zero, hospitalization rates in NYC would be expected to be 3.8 (95% confidence interval [CI] = 1.3, 6.3) per 100 000 person-years higher than the observed rate. If the pandemic period is included in the DID estimation model, the counterfactual rate would be 1.8 (95% CI = −0.8, 4.4) injuries per 100 000 person-years higher than the observed rate.

