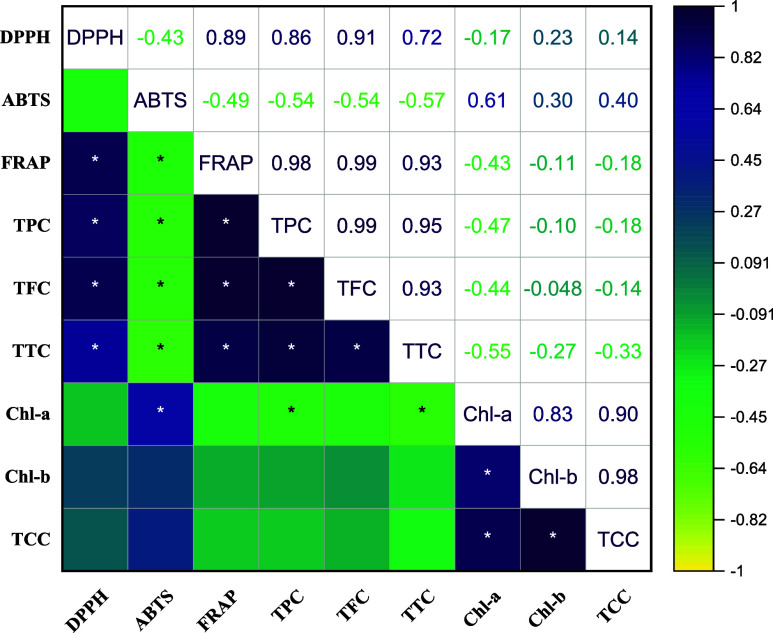
Figure 3.
Correlation matrix heatmap shows the values of the Pearson correlation coefficient for all studied parameters: the positive values are in red, and negative values are in blue. It ranges from −1 to 1, where by −1 means a perfect negative linear relationship between variables, 1 indicates a perfect positive linear relationship between variables and 0 indicates that there is no relationship between studied variables. (*significance difference level p < 0.05).

