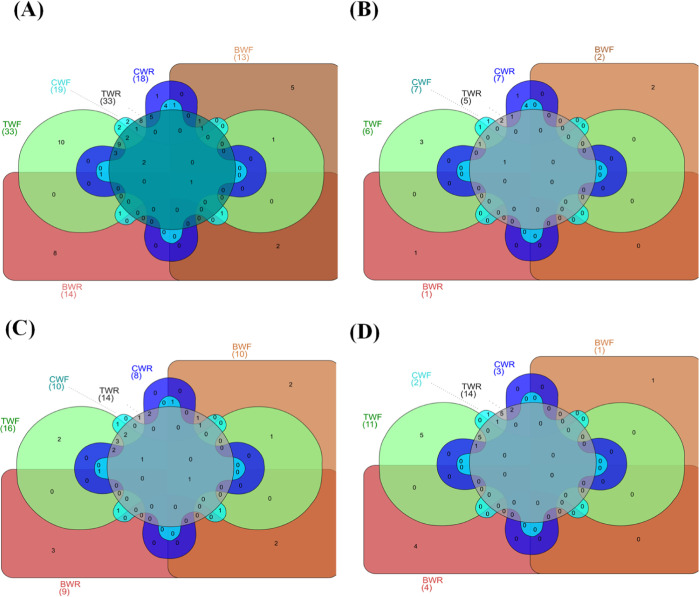
Figure 5.
Venn diagram of phenolic compounds present in different predrying cell rupture methodologies. (A) Relation of total phenolic contents among the different cell rupture methodologies. (B) Relation of phenolic acids among the different cell rupture methodologies. (C) Relation of flavonoids among the different cell rupture methodologies. (D) Relation between the other polyphenols in different cell rupture methodologies.

