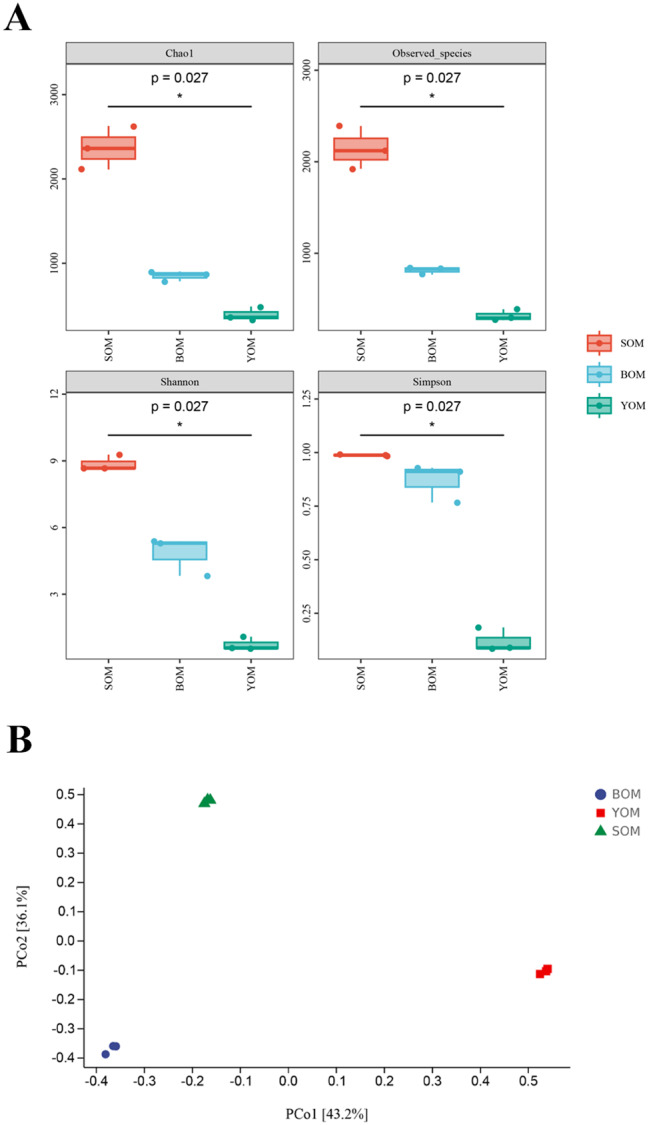
Fig. 4.

Comparison of microbial diversity in different cave samples. (A) Alpha-diversity analysis of S. martensi microbiome. Species richness and diversity were measured by Shannon, Simpson, Chao1 and Observed_species. Each panel corresponds to an alpha-diversity index, which is identified in the gray area at its top. In each panel, the abscissa is the grouping label, and the ordinate is the value of the corresponding alpha diversity index. The number under the diversity index label is the P value of the Kruskal-Wallis test. (B) Principal coordinate analysis (PCoA) of microbiome based on Bray-Curtis distances
