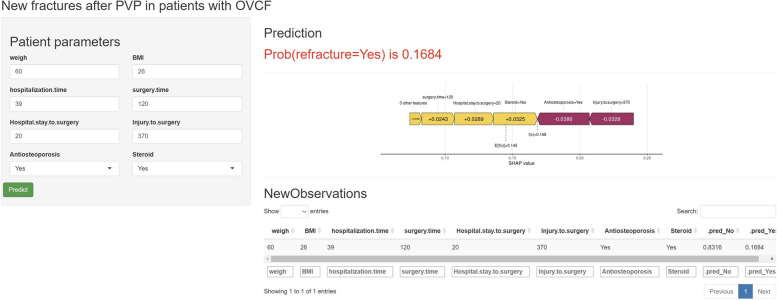
Fig. 6.
Web calculator interface and SHAP value analysis for OVCF risk prediction. The interface shows input fields for patient parameters relevant to the prediction of new fractures after PVP in patients with OVCF. After entering these parameters and clicking "Predict," the model calculates the probability of a fracture occurring and displays it along with a graph of SHAP values to the right.The SHAP value graph illustrates the contribution of each parameter to the model's prediction, with a positive SHAP value indicating an increased risk of a fracture and a negative SHAP value indicating a decreased risk of a fracture. The length of each bar indicates the level of influence of the feature, and the colour indicates the direction of influence (purple for positive influence, yellow for negative influence)

