Figure 3.

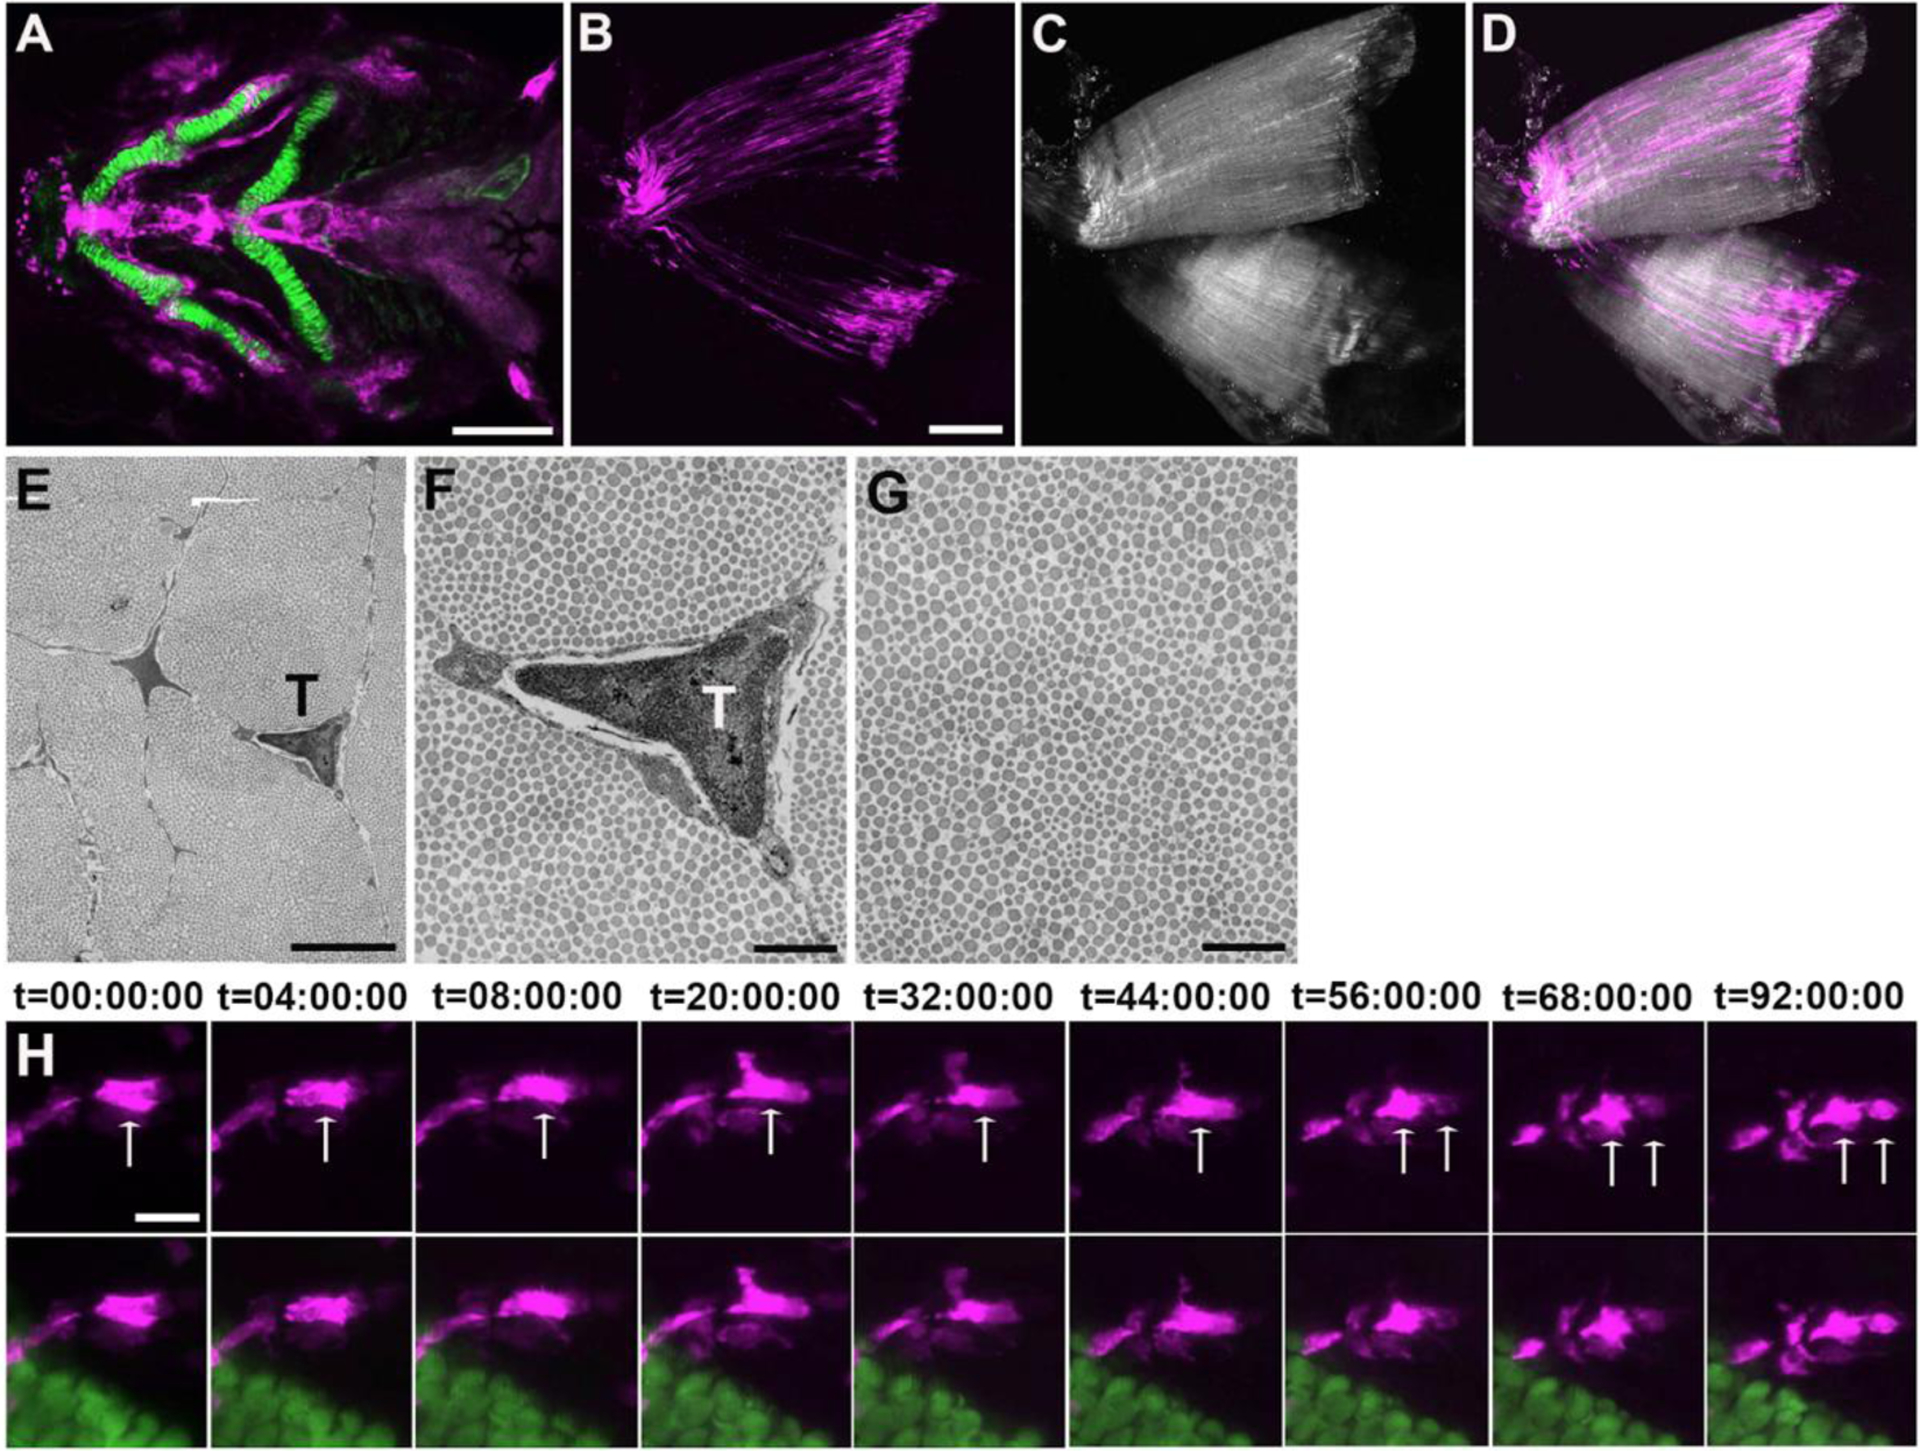
Zebrafish craniofacial tendon and tendon cell division during tendon regeneration. (A) A double transgenic line shows scxa:mcherry; col2a1a:eGFP expression at 3dpf. Scale bar, 50μm; (B-D) Multiphoton images of sternohyoideus tendon at 180 dpf show scxa:gal4-vp16; uas:epNTR-RFP+ tendon cells (B, D) and second harmonic generation (SHG) of collagen fibril (C, D). Scale bar, 100μm; (E) Ultrastructural examination of tendon cells and collagen fibrils by TEM. Scale bar, 2μm; (F, G) Magnified examination of tendon cells and collagen fibrils in (E). Scale bar, 0.5μm; (H) Time lapse imaging of ceratohyal cartilage region shows tendon cell division during tendon regeneration. scxa:gal4-vp16; uas:epNTR-RFP+ labels tendon cells (white arrows indicate a cell undergoing division) and col2a1a:eGFP labels ceratohyal cartilage. Scale bar, 25μm. In (H), tendon cells were ablated at 3–5 dpf, t=00:00:00 was immediately after the cell ablation. T, tendon cell. Images A-D, H, anterior to the left. Images E-G, transverse section.
