Figure 1.
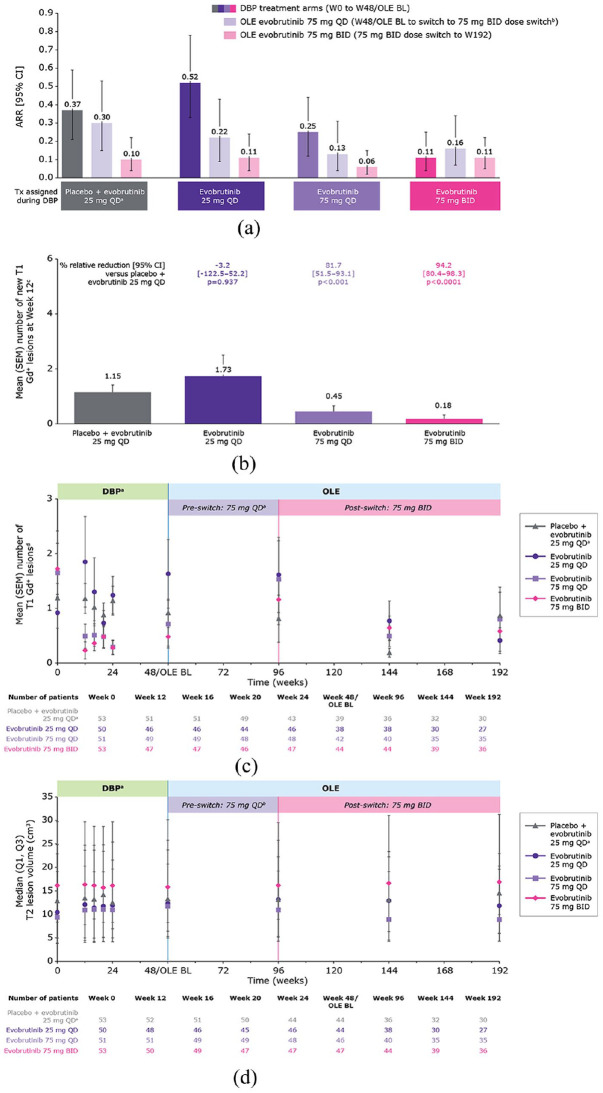
(a) Annualised relapse rate. (b) Mean (SEM) number of new T1 Gd+ lesions at week 12. (c) Mean (SEM) number of T1 Gd+ lesions over time. (d) Median T2 lesion volume over time.
ARR (95% CI) for the whole OLE period (week 48/OLE BL to week 192) was: placebo + evobrutinib 25 mg QD, 0.18 (0.10–0.28); evobrutinib 25 mg QD, 0.15 (0.08–0.26); evobrutinib 75 mg QD, 0.09 (0.04–0.16); evobrutinib 75 mg BID, 0.13 (0.07–0.22).
Cut-off 30 September 2021.
aPatients switched from placebo to evobrutinib 25 mg QD after 24 weeks in the DBP.
bEvobrutinib-treated patients (n = 151), mean (±SD) duration of exposure to evobrutinib 75 mg QD dose before the switch to 75 mg BID: 50.6 (±6.0) weeks.
cMean number of new T1 Gd+ lesions was estimated using negative binomial regression, with covariates for presence or absence of baseline T1 Gd+ lesions and treatment arm.
dT1 Gd+ lesion counts reported here were measured at individual time points (and do not represent annualised or cumulative values).
ARR: annualised relapse rate; BID: twice-daily; BL: baseline; CI: confidence interval; DBP: double-blind period; Gd+: gadolinium-enhancing; OLE: open-label extension; QD: once-daily; SD: standard deviation; SEM: standard error of mean; Tx: treatment; W: weeks.

