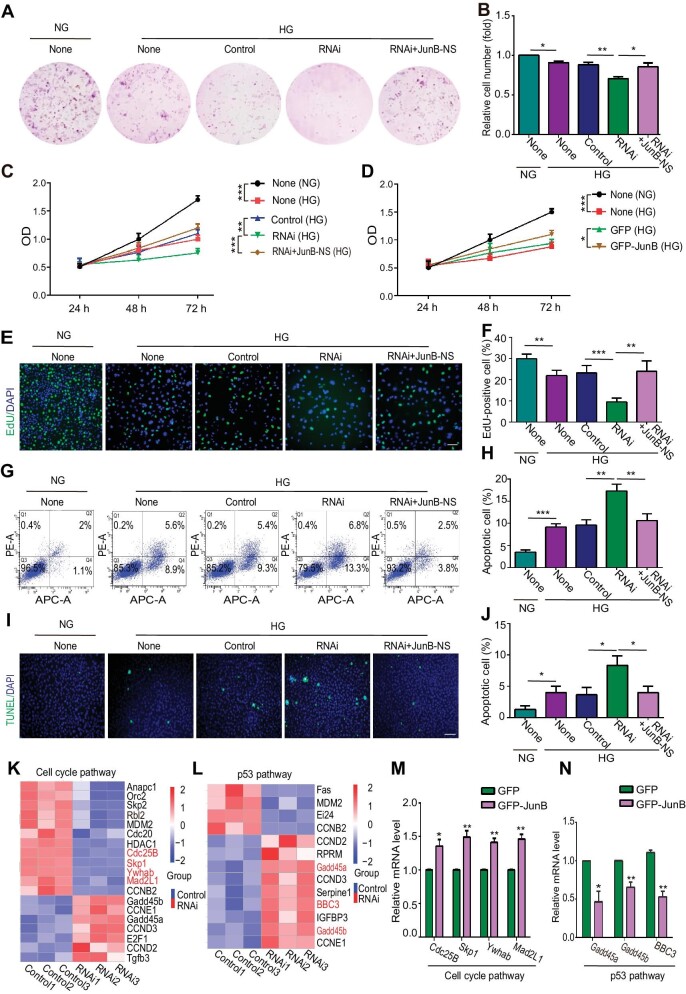
Figure 2.
JunB reverses the effects of high glucose on EC proliferation and apoptosis. HUVECs were treated as indicated: NG, 5.5 mM glucose; HG, 60 mM glucose; None, without transfection reagents or oligonucleotides; Control, only with transfection reagents; RNAi, with both transfection reagents and oligonucleotides; RNAi+JunB-NS, infected by lentivirus after adding transfection reagents and oligonucleotides. (A and B) The colony forming ability of cells. Representative colony formation pictures (A) and the ratio of cell number relative to the None (NG) group (B) (n = 5). (C and D) The optical density (OD) of cells with JunB depletion (C) or GFP-JunB overexpression (D) was determined by the CCK8 assay. (E and F) Cell proliferation was determined by the EdU assay. Scale bar, 75 μm. (G and H) Cell apoptosis was determined by flow cytometry with Annexin V (abscis) and PI (ordinate) staining. Apoptotic cell percentage was the sum of Q2 and Q4 percentages. (I and J) Cell apoptosis was determined by the TUNEL assay. Scale bar, 250 μm. (K and L) RNA-seq performed with control or JunB-depleted HUVECs under high glucose determined the differential expression of genes in the cell cycle pathway (K) or p53 pathway (L). The genes verified positive by RT‒qPCR are indicatedin red. (M and N) RT‒qPCR showed up-regulation of Cdc25B, Skp1, Ywhab, and Mad2L1 and down-regulation of Gadd45a, Gadd45b, and BBC3 in HUVECs overexpressing GFP-JunB. Error bars represent mean ± SEM, n = 3 independent experiments if not stated. Significance was determined using two-tailed t-test. *P < 0.05, **P < 0.01, ***P < 0.001.

