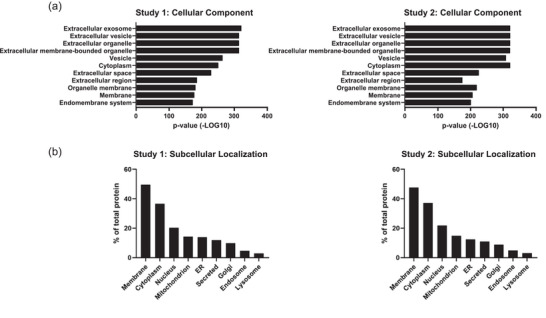
FIGURE 3.

Proteomic overview of tissue‐derived EVs. (a) The top GO terms for cellular components in terms of p‐value that are associated with the proteins identified in the two sets. The order is according to Study 1, starting with the lowest p‐value on top. (b) The cellular localization of the proteins identified in the two sets. Added together, these exceed the total amount of proteins found because a protein can belong to several localization groups.
