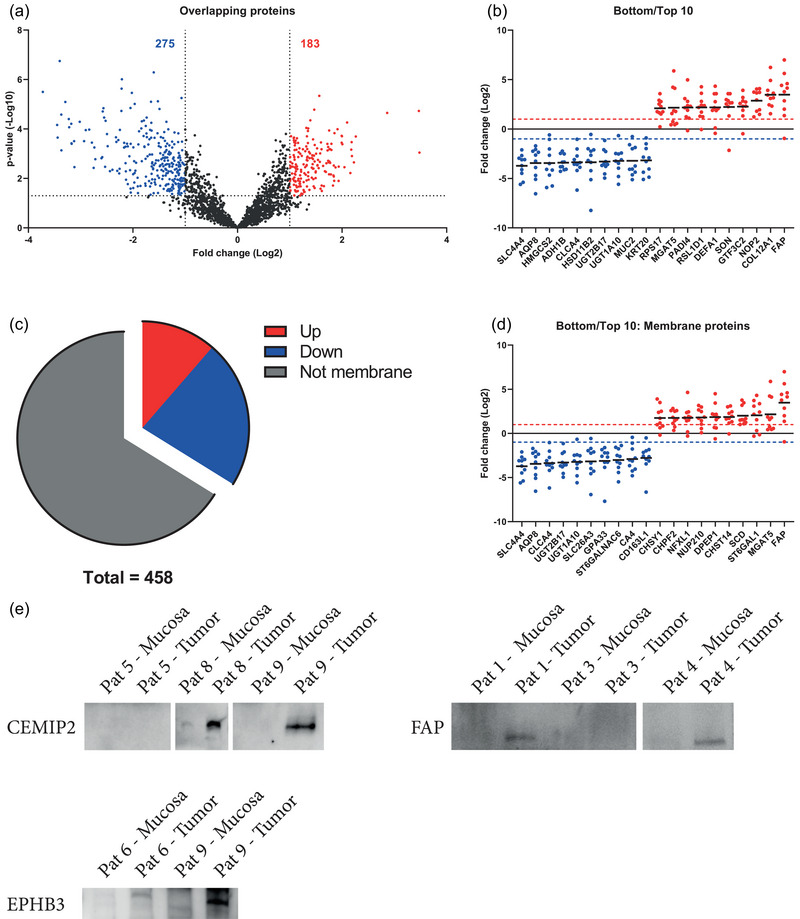
FIGURE 5.

Quantitative differences in proteins between tumours tissue‐derived EVs and mucosa‐derived EVs. (a) Volcano plots of the proteins common for both sets. The dotted lines indicate the cut off, which is 1.3 on the Y‐axis (corresponding to a p‐value of 0.05) and 1 on the X‐axis (corresponding to a fold change of 2). Red is representative of an enrichment in tumour‐derived EVs while blue represents a decrease. (b) The top 10 upregulated and top 10 downregulated proteins in each study according to fold change (red and blue dotted lines intercept the y‐axis at a fold change of 2). (c) Pie chart showing the portion of significantly regulated proteins that are membrane proteins. (d) The top 10 upregulated and top 10 downregulated membrane proteins in tumour tissue EVs.
