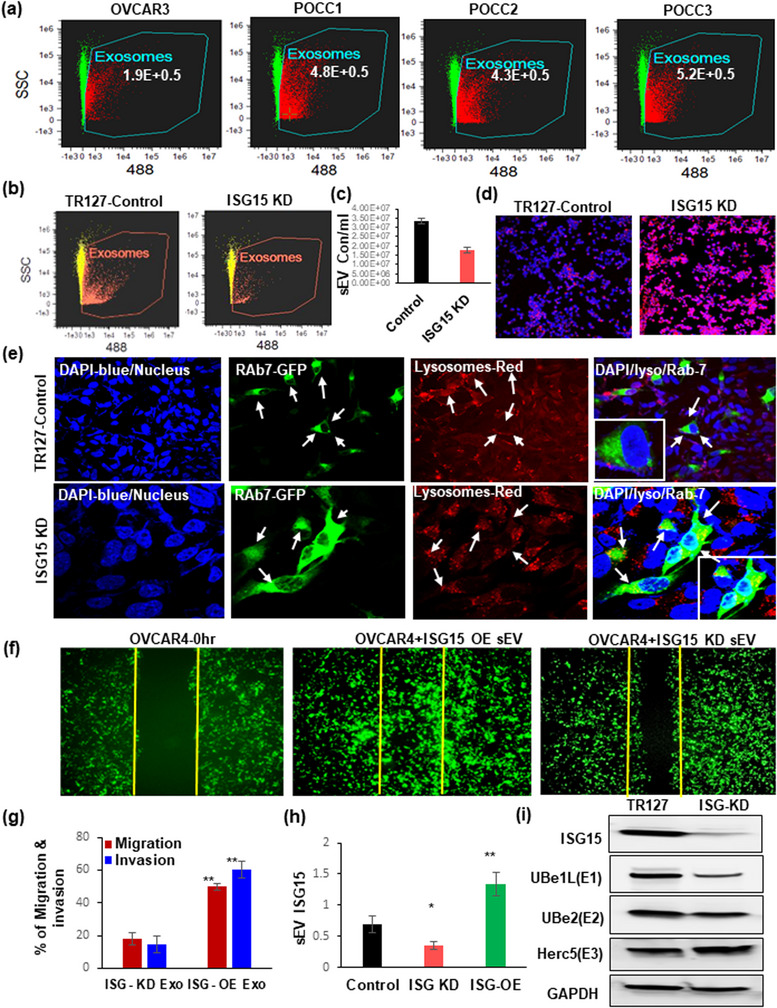
FIGURE 2.

Extracellular vesicles’ concentration and their ISG15 expression influence ovarian cancer migration and invasion: (a) Comparison of small extracellular vesicle (sEV) quantification in immortalized HGSOC cell line –OVCAR3 and ascites derived POCCs by Image stream analysis (ISA) (n = 3 samples ± SD). (b and c) Knockdown of ISG15 in TR127‐ at 24 h decreases extracellular vesicle population as analysed by ISA (n = 3 samples ± SD). (d) Analysis of the lysosomal staining in ISG15‐KD TR127 cells at 24 h by confocal microscopy. (e) Co‐localization of Rab7‐GFP late endosomes (green) with lysosomes (red) observed in TR127‐ISG‐15‐KD cells after 24 h after transfection when compared with TR127 control cells at 40× magnification with 3× zoom images (inner square) in the merged channels. (f and g) Cell migration in vitro: Comparison of the wound healing effect in GFP labelled OVCAR4 cells after internalization of vesicles isolated from TR127 –ISG15 over expression (OE) or knockdown (KD) cells after 48 h. (h) Expression of vesicular ISG15 in ISG‐OE and ‐KD TR127 cells when compared to control TR127 cells at 24 h. (i) Influence of ISG15 knockdown in TR127 cells on the ISGylation enzymes by western blot analysis.
