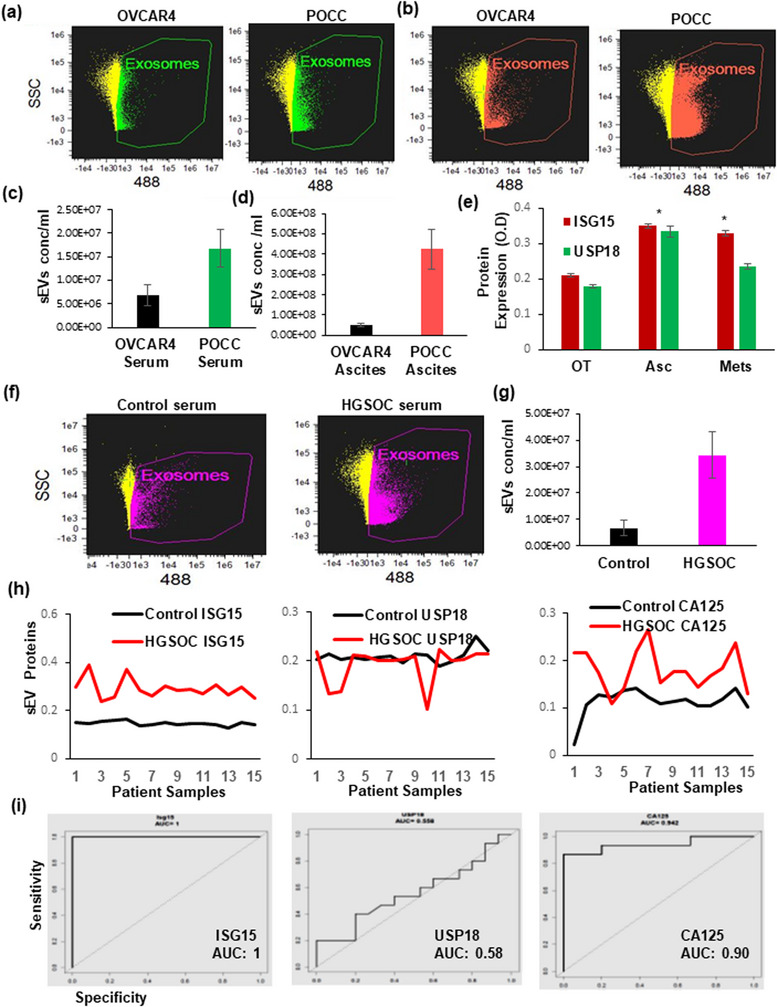
FIGURE 6.

ISG15 expression in ascites and serum as prognostic biomarker in HGSOC mouse models and patients. (a–c) sEV quantification in OVCAR4 and TR127 transplanted mice serum and ascites (n = 3). (d) Relative expression of ISG15 and USP18 in primary and metastatic mouse ovarian cancer tissue compared to ascites by ELISA (n = 6). (e and f) sEV levels in control and HGSOC patient serum samples (n = 3). (g) ISG15, USP18 and CA125 expression in healthy control and HGSOC patient serum sEV (n = 15). (h) ROC curves based on ELISA results from small EVs isolated from controls and HGSOC serum samples analysed the ISG15, USP 18 and CA125 (n = 12).
