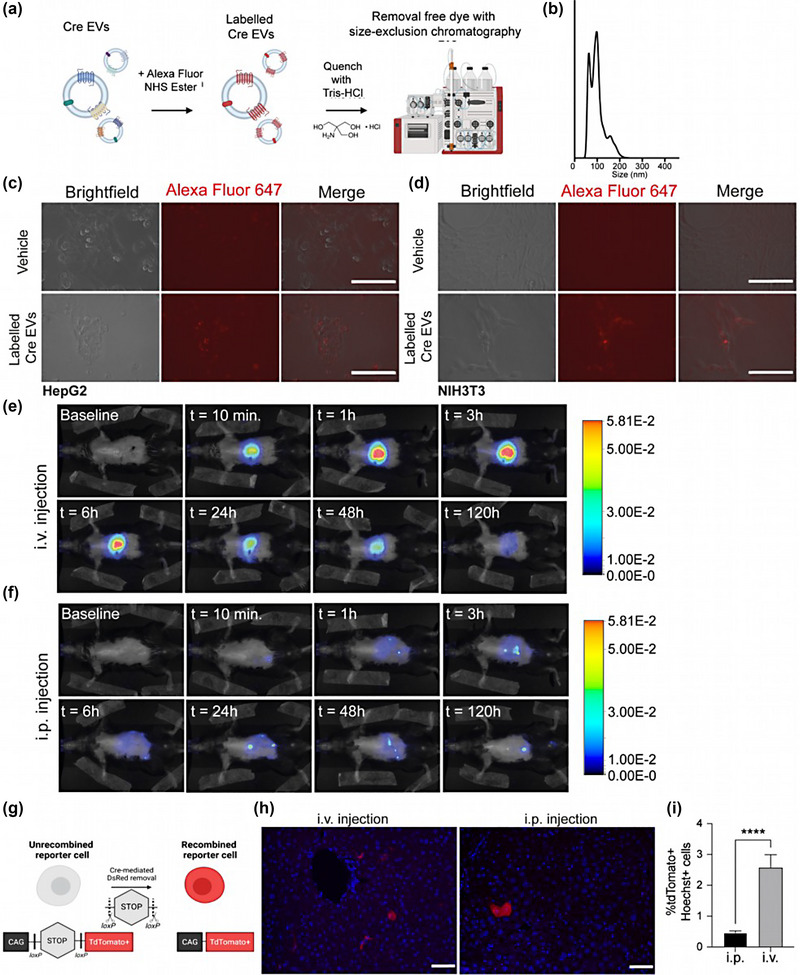
FIGURE 2.

Higher liver protein delivery upon intravenous administration of Cre‐EVs as compared to intraperitoneal injection. (a) Schematic illustration of labeling EVs with an Alexa Fluor NHS ester, followed by dye quenching and separating the free dye from the labeled EVs through SEC. (b) NTA analysis of AlexaFluor647‐labeled EVs showed size distribution between ± 50–200 nm. The uptake of AlexaFluor647‐labeled EVs (in red) was confirmed in (c) HepG2 and (d) NIH3T3 cells by fluorescent microscopic analysis. Representative live images of in vivo tracking of AlexaFluor790‐labeled EVs in Ai9 Cre‐loxP reporter mice that received Cre‐EVs through (e) i.v.‐or (f) i.p. injection over 120 h by NIRF imaging. (g) Schematic illustration of Cre‐mediated recombination in Ai9 Cre‐loxP reporter mice, wherein the functional intracellular delivery of Cre will lead to Cre‐recombined tdTomato+ cells. (h) Immunofluorescence images from liver sections. Blue = Hoechst, Red = tdTomato+, scale bar = 50 μm. (i) Immunofluorescence quantification of total tdTomato+Hoechst+ cells in liver tissue sections from Ai9 Cre‐loxP reporter mice that received Cre‐EVs either through i.v. or i.p. injection. Statistical analysis was performed via an unpaired t‐test with p‐values *<0.05, **<0.01, ***<0.001, and ****<0.0001 considered statistically significant. Per group n = 3, total n = 6.
