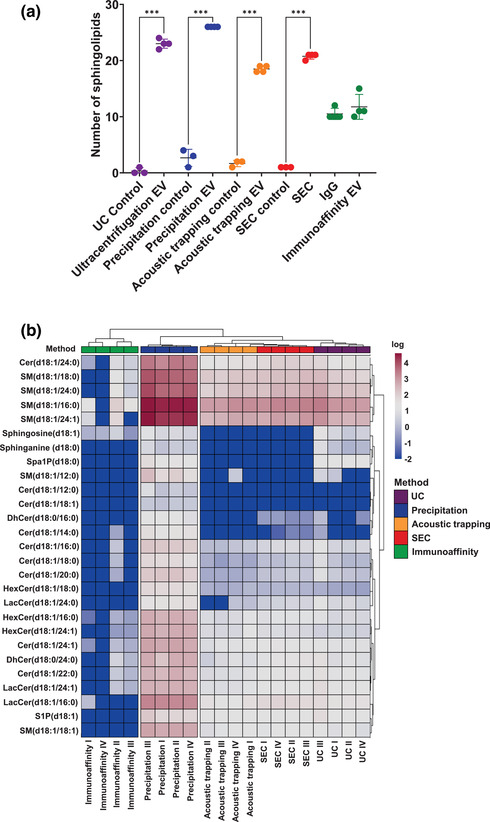
FIGURE 5.

Sphingolipidomic analysis of plasma EV from different isolation methods. (a) Number of sphingolipids quantified in plasma extracellular vesicles (EV) isolated by ultracentrifugation (UC), precipitation, acoustic trapping, size‐exclusion chromatography (SEC) and immunoaffinity capture and subjected to targeted sphingolipid analysis versus control vehicle (PBS) or an IgG control. Data are group averages ± standard deviation (SD) and were analysed by One‐way ANOVA with post‐hoc Bonferroni correction. ***p < 0.001 (n = 4). (b) Heat map of plasma EV sphingolipids. Values from control samples were subtracted to account for background and the values were log normalised. Hierarchical clustering of the isolation methods was conducted using a complete clustering method (n = 3–4). Data were analysed by Kruskal‐Wallis test with post‐hoc Bonferroni correction.
