FIGURE 3.

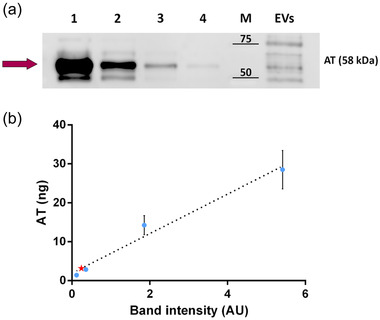
Semi‐quantitative analysis of AT concentration on EVs. (a) EV‐bound AT was measured using Western blot. Diluted plasma samples were used as standards. Lanes from 1 to 4 contain a diluted amount of plasma. Total protein loaded: 12.74 μg in lane 1; 6.37 μg in lane 2; 1.27 μg in lane 3; 0.64 μg in lane 4. The “EVs” lane was loaded with 1.41 μg of proteins, corresponding to the EVs separated from 160 μl of plasma. AT band (58 kDa) is highlighted by the purple arrow. (b) The calibration line created by plotting and linearly fitting (R 2 = 0.9488) the amount of AT calculated for plasma loaded in lanes 1–4 versus the corresponding band intensity measured through densitometric analysis. Blue dots: diluted plasma samples (Mean ± SD plotted). Red star: EV sample
