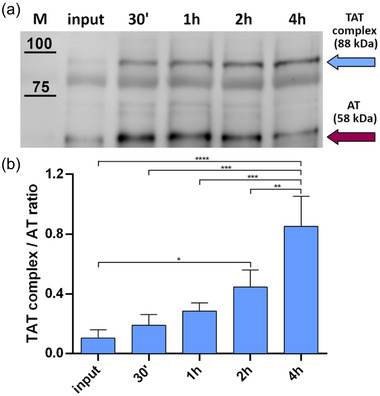
FIGURE 5.

Determination of AT anticoagulant activity. EV‐bound AT activity was assessed through the formation of the TAT complex. Fixed amounts of EVs (carrying ∼ 1.5 ng of AT) were challenged with 0.06 U of heparin and 0.0025 U of thrombin. A representative image of three experiments is shown, together with the calculation of TAT complex and AT ratio by densitometric analysis. (a) TAT complex formation was measured at different timepoints through Western blot. Cyan arrow = TAT complex band. Purple arrow = AT band. (b) Normalized TAT complex/AT ratio at different timepoints. For each timepoint, the TAT complex band intensity was normalized on the respective AT band intensity (posed equal to 1). The input corresponds to TAT complex/AT ratio at T = 0 min. The displayed values represent the mean ± SD of three independent experiments. Significant differences in TAT complex formation at different timepoints were determined with one‐way ANOVA test. P‐values <0.05 were considered statistically significant. *P < 0.05, **P < 0.01, ***P < 0.001, and ****P < 0.0001
