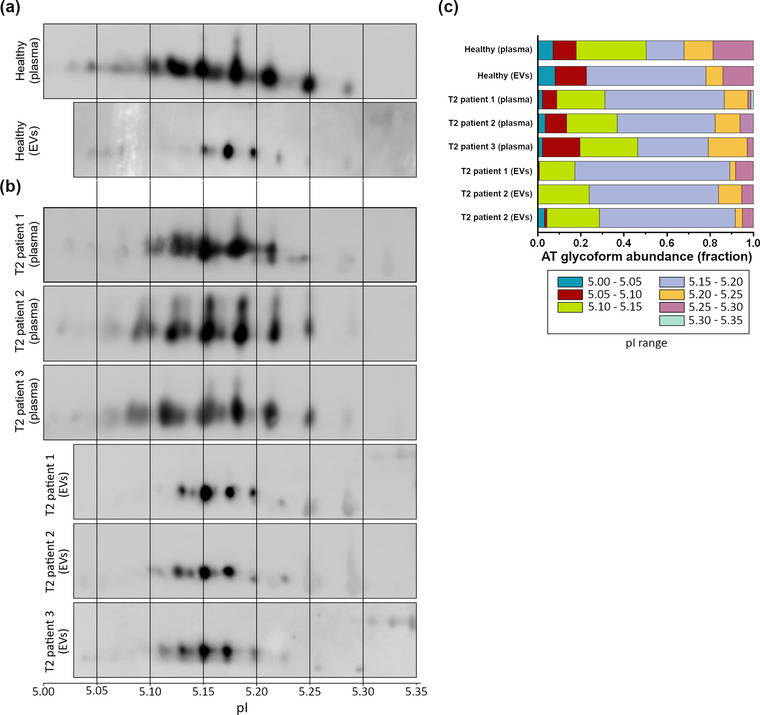
FIGURE 6.

2D SDS‐PAGE in reducing conditions on total plasma and isolated EV samples. (a) Comparison of the 2D profile of soluble AT in total plasma (above) and EV‐associated AT (below), both derived from samples of healthy subjects. pI is indicated. The number of spots is considerably different from plasma to EVs, suggesting a degree of “EV‐specificity” of some AT glycoforms. (b) 2D SDS‐PAGE of whole plasma and EV‐associated AT derived from three T2 patients, showing a different migration pattern of the AT‐EVs in respect to the control healthy sample. (c) Densitometric analysis of the spots of soluble and EV‐associated AT of healthy subjects and T2 patients. Differences in the relative abundance of AT glycoforms have been highlighted both in soluble and EV‐associated AT of healthy subjects and in EV‐associated AT of healthy subjects and T2 patients
