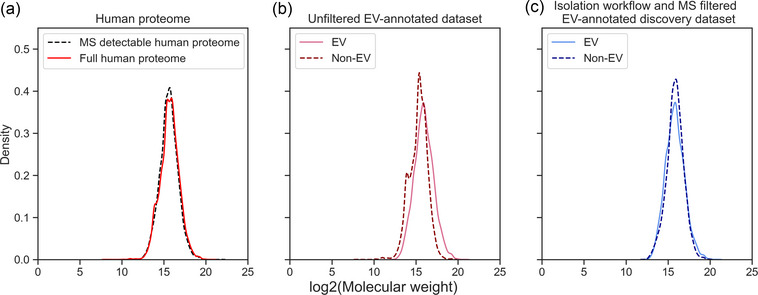
FIGURE 2.

Density plots of log2‐transformed molecular weight across the human proteome and EV‐annotated datasets. (a) Distribution of log2‐transformed molecular weight of the MS‐detectable human proteome compared to the full human proteome. MS struggles to detect low molecular weight proteins of the human proteome. (b) The molecular weight densities of EV and non‐EV proteins in the unfiltered EV annotated dataset highlight the discrepancy in molecular weight between EV and non‐EV proteomes. (c) The much more similar molecular weight distribution of EV and non‐EV group show how the MS filter step diminishes the experimental bias introduced by MS. EV, extracellular vesicle; MS, mass spectrometry.
