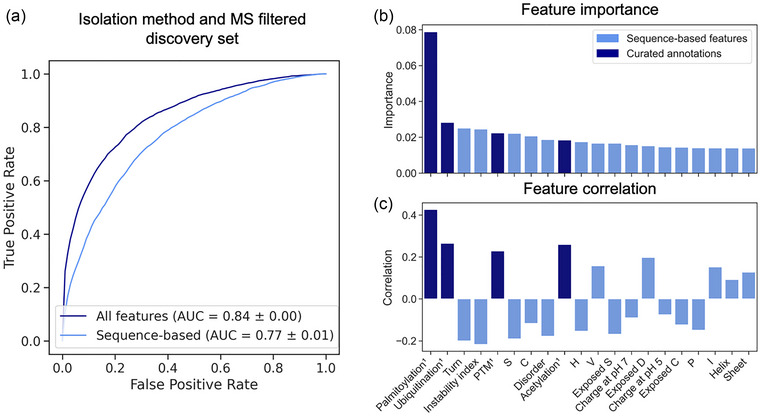
FIGURE 3.

Performance of RF model and feature importance analysis. (a) ROC curves and AUC display the performance of the RF classifiers using sequence‐based features (light blue) and sequence‐based features and curated annotations (dark blue). (b) Bar plots show the Gini importance of the top 20 features for EV prediction as well as the correlation of these features with the EV class (c). Note that (b) and (c) share the same labels. PTMs, stability, structure, and polarity differentiate EV and non‐EV proteins. Dark blue features are curated annotations. AUC, area under the curve; C, cysteine; D, aspartic acid; EV, extracellular vesicle; H, histidine; I, isoleucine; P, proline; PTM, post‐translational modification; RF, random forest; ROC, receiver operating characteristic; S, serine; V, valine.
