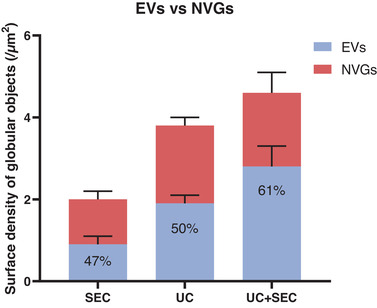
FIGURE 8.

The combination of UC and SEC gave the highest percentage of EVs compared to NVGs. Quantification of EVs (blue) versus non‐vesicular globules (NVGs) (red) in the total amount of objects detected with AFM imaging. EVs separated using size exclusion chromatography (SEC), ultracentrifugation (UC) or a combination of both (UC+SEC) was analysed. The amount of vesicular‐like structures in the EV preparations is stated in percentage. Error bars: Mean ± SD. n = 6 for each sample
