
FIGURE 5.
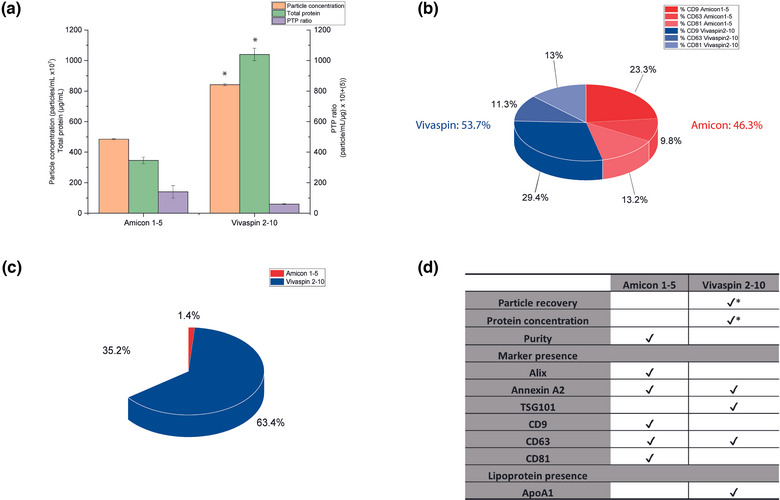
Comparison of EV preparations recovered using Amicon (fractions 1–5) and Vivaspin (fractions 2–10) UF + SEC. (a) Representation of sample purity. Particle (left Y axis) and protein concentrations and PTP ratio (right Y axis), representing purity for both Amicon 1–5 and Vivaspin 2–10 preparations. (b) Main tetraspanins presence (%). CD9, CD63, and CD81 nFCM measurements showed in and 4 . (c) Lipoprotein band quantification. Representation of WB bands quantifications by ImageJ. (d) Summary table indicating the main outcomes to select the isolation protocol of choice. Method criteria for marker presence was based on WB detection differences supported by nFCM data where appropriate. Different outcomes and characteristics of the isolation protocols described earlier might influence the application of each technique.