
FIGURE 4.
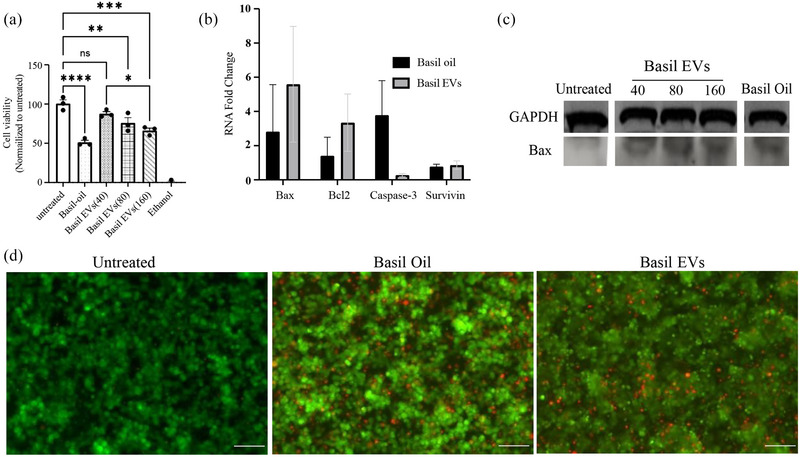
BasEVs inhibit cell growth in MIA PaCa‐2 cells. (a) MTS assay results showing a dose‐ dependent reduction in cell viability of MIA PaCa‐2 cells after BasEV treatment. (b) RT‐PCR analysis of apoptosis‐relevant mRNA expression levels upregulated upon treatment with BasEV. (c) Western blot of Bax and GAPDH protein levels in Mia PaCa‐2 treated with various concentrations of BasEVs (40, 80, and 160 μg/mL). (d) LIVE/DEAD assay images of MIA PaCa‐2 cells showing propidium iodide‐stained dead cells and calcein green stained live cells. Scale bar is 260 μm. Standard error mean was used to plot the graphs with *P ≤ 0.05, **P ≤ 0.01, ***P ≤ 0.001, and ****P ≤ 0.0001.