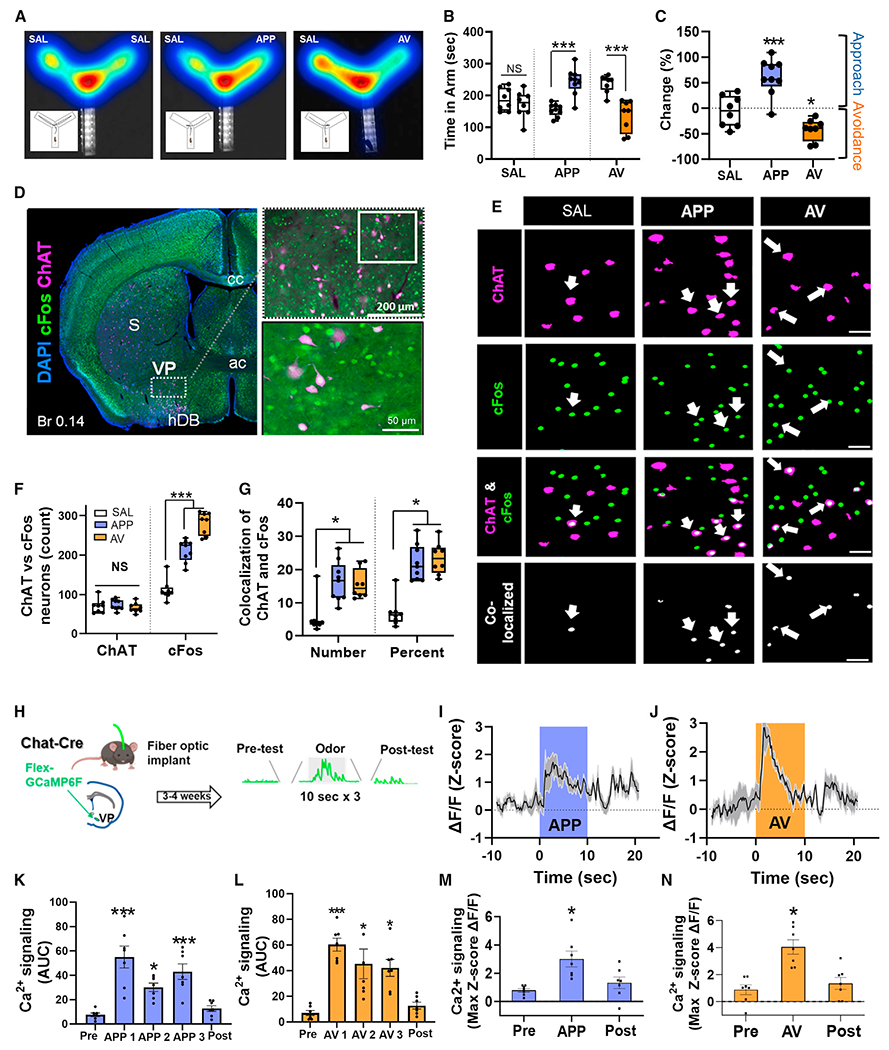
Figure 1. Appetitive and aversive odors activate VP cholinergic neurons.

(A) Example heatmaps from the behavioral paradigms tested (from left to right): saline (SAL), appetitive odor (APP), aversive odor (AV). Insets illustrate the typical path traveled by mice under each condition. Left: presentation of SAL in both test arms results in approximately equal time spent in each arm. Middle: presentation of an APP odor in one arm elicits approach behavior. Right: presentation of an AV odor elicits avoidance behavior.
(B) Left: total time spent in each arm under SAL vs. SAL conditions, compared with SAL vs. APP and SAL vs. AV conditions.
(C) Behavioral responses measured as percent change of time spent in odor vs. SAL arm.
(D) Left: representative image of activated cholinergic neurons in a coronal slice (Br 0.14) following odor preference test. Right: higher-magnification images of a representative area within the VP (top; scale bar, 200 μm), with additional magnification of the demarcated area in the inset shown below (scale bar, 50 μm). Blue, DAPI; green, cFos; magenta, ChAT.
(E) Representative high-magnification images of the VP following ChAT and cFos immunohistochemistry. First column, SAL; second column, APP odor; third column, AV odor. Rows are representative images for ChAT (first row), cFos (second row), the overlay between ChAT and cFos (third row), and co-localization between ChAT and cFos (fourth row). Scale bars, 50 μm. Arrowheads represent co-localized ChAT and cFos neurons in the VP.
(F) Total counts of neurons immunostained for both ChAT and cFos.
(G) Co-localization of ChAT and cFos in the VP in total numbers (left) and percentage of ChAT+ neurons that co-express cFos (right).
(H) Workflow and timeline for in vivo fiber photometric assays.
(I and J) VP FLEX-GCaMP6f traces in response to the first 10-s delivery of the APP odor (I) and AV odor (J). Shaded area represents the time window for odor delivery.
(K and L) Area under the curve (AUC) measurements before, during, and following each APP odor (K) or AV odor (L) delivery.
(M and N) Maximum Z-score ΔF/F before, during, and following APP odor (M) and AV odor (N) exposure.
*p < 0.05, ***p < 0.001, NS, not significant. Error bars represent mean ± SEM. For both behavior and IHC experiments (A–G), sample sizes are as follows: SAL, n = 8 mice, 4 males and 4 females; APP odor, n = 9 mice, 4 males and 5 females; AV odor, n = 8 mice, 4 males and 4 females. For fiber photometry experiments, n = 7 mice, 5 males and 2 females.
