
Figure 3. Assessment of activated and reactivated VP cholinergic neurons using genetic and immediate-early gene probes following repeat odor presentation.
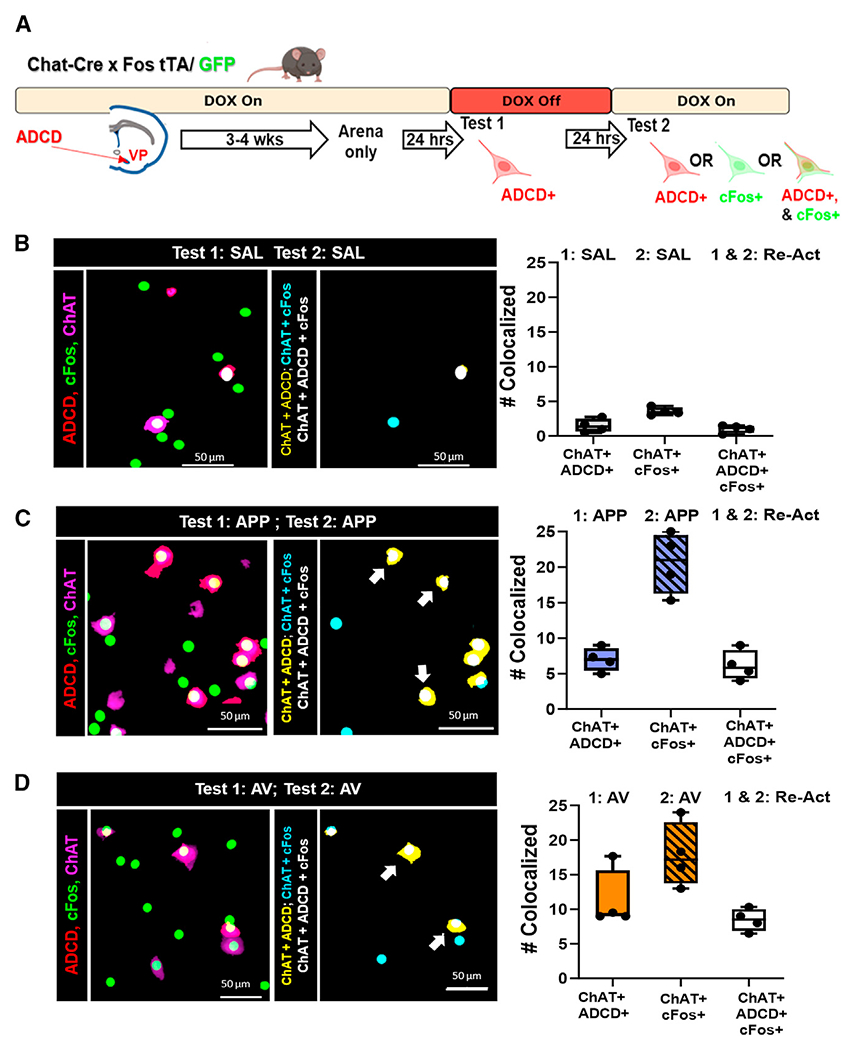
(A) Schematic diagram of the strategy employed to differentially label VP cholinergic neurons that were activated in same or distinct contexts.
(B) Mapping and quantification of the activation and reactivation profile of VP cholinergic neurons following two exposures to SAL (n = 4 mice; 2 males and 2 females). Left: representative image of ADCD (red), cFos (green), and ChAT (magenta). Mapping of the co-localization of the indicated probes is shown in the right image. Right: quantification of the number of VP cholinergic neurons activated by test 1 (ChAT+ and ADCD+), those activated by test 2 (ChAT+ and cFos+), and the neurons that were reactivated (ChAT+, ADCD+, and cFos+).
(C) Mapping (left) and quantification (right) of the activation and reactivation profile of VP cholinergic neurons following two test exposures to the same APP odor (n = 4 mice; 2 males and 2 females).
(D) Mapping (left) and quantification (right) of the activation and reactivation profile of VP cholinergic neurons following two test exposures to the same AV odor (n = 4 mice; 3 males and 1 female). Error bars represent mean ± SEM. Scale bars, 50 μm.