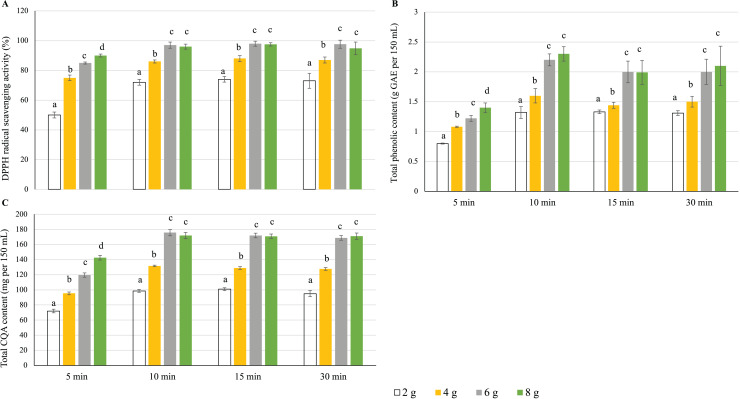
Figure 3. Effects of the water/leaf mass ratio and steeping time on the (A) antioxidant activity, (B) total phenolic content, and (C) total CQA content of yerba mate infusions. Error bars represent mean ± standard deviation (n = 3).
For each steeping time, comparisons are made among different leaf weights; bars with different letters differ significantly (p < 0.05).

