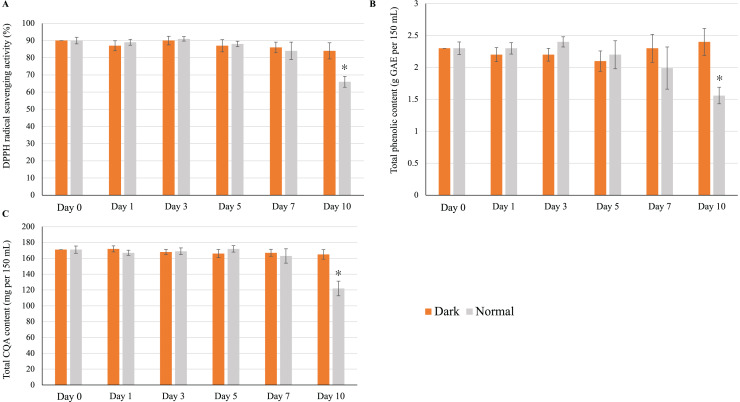
Figure 6. Effect of low-temperature storage on the (A) antioxidant activity, (B) total phenolic content, and (C) total CQA content of yerba mate infusions.
Error bars represent mean ± standard deviations (n = 3). For each day, an asterisk (*) above the bars indicates a significant difference compared to the sample at day 0 (control) (p < 0.05).

