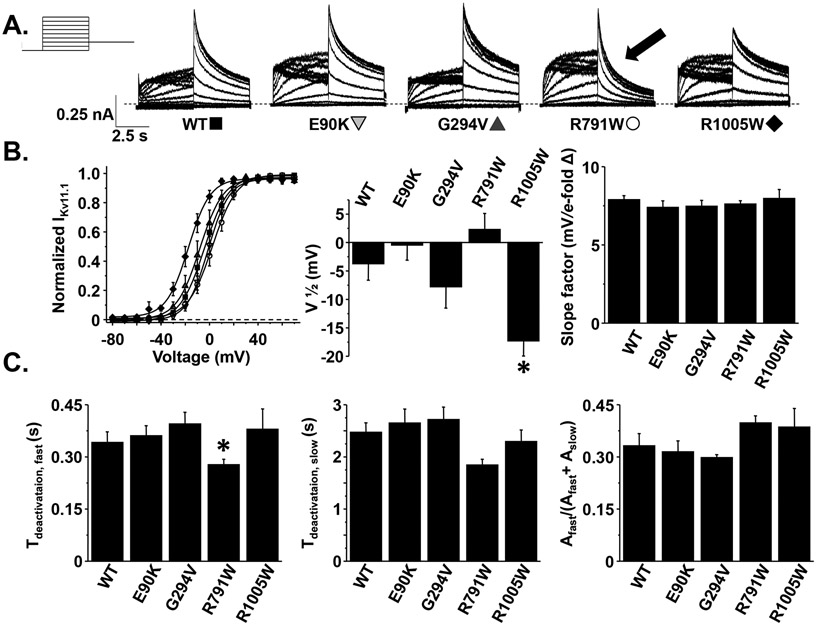
Figure 2. The R1005W and R791W variants alter Kv11.1 channel activation and deactivation, respectively.
A) Representative families of currents measured from cells transiently expressing WT-, E90K-, G294V-, R791W-, or R1005W-Kv11.1 channels using the voltage protocol shown. B) The left graph shows the I-V relations of (normalized to the peak ) measured during the test-pulse and plotted as a function of the pre-pulse from cells expressing WT (solid squares), E90K (shaded downward triangles), G294V (shaded upward triangles), R791W (open circles), and R1005W (solid diamonds). C) The decay measured during the test-pulse following the pre-pulse to 70 mV was described as a double exponential process to calculate the fast and slow time-constants associated with Kv11.1 deactivation ( and ). The right graph shows the relative amplitude of the divided by the total amplitude of and () (n = 8-15 cells per group, *P < 0.05). Error bars are SE.

