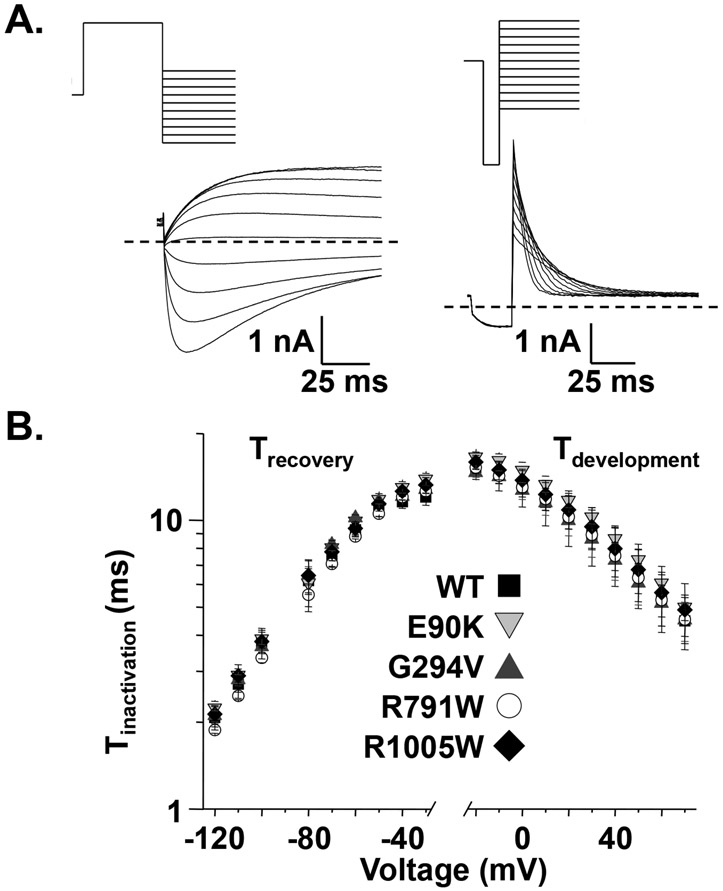
Figure 4. KCNH2 variants found in SIDS cases do not alter Kv11.1 channel inactivation.
A) Representative families of currents measured from cells expressing WT using the voltage protocols to measure the recovery (left side) and development (right side) of inactivation are shown. The was calculated by describing the rising phase of measured during the test-pulse as a single exponential process, and similarly, the was calculated by describing the falling phase of measured during the test pulse as a single exponential process. B) The left and right sides of the graph shows the mean and , respectively, calculated from cells expressing WT- (solid squares), E90K- (shaded downward triangle), G294V- (shaded upward triangle), R791W- (open circle), or R1005W-Kv11.1 (solid diamond) plotted as a function of the test-pulse (n = 5-14 cells per group, P > 0.05). Error bars are SE.

