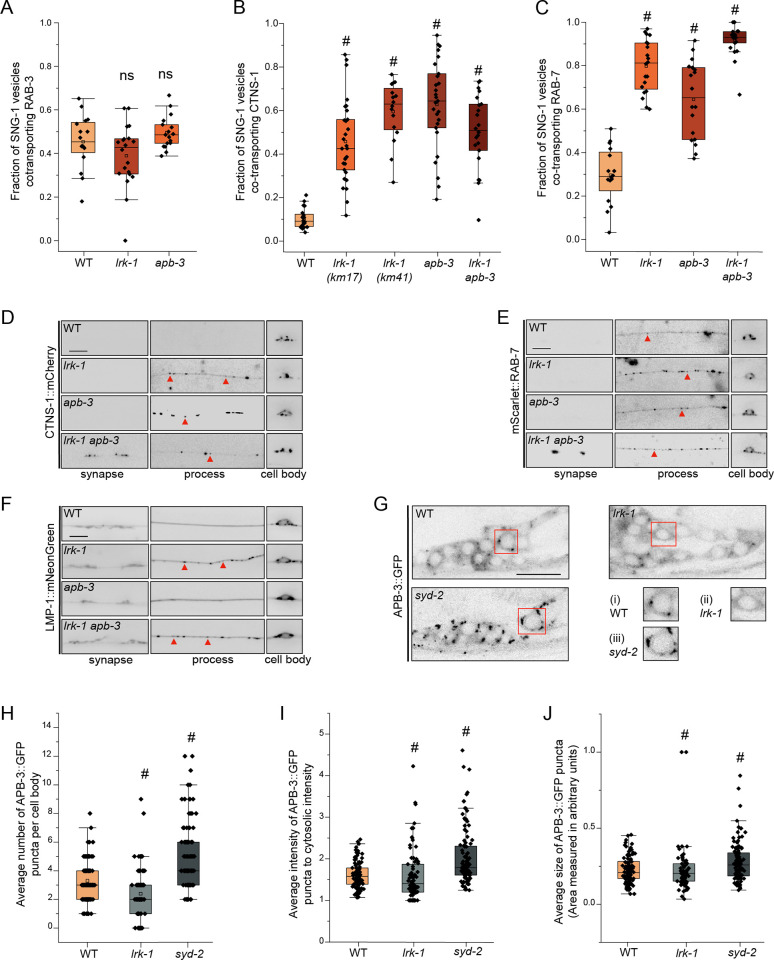
Fig 2. LRK-1 and AP-3 act in parallel and through SYD-2 to regulate lysosomal protein trafficking.
(A) Quantitation of fraction of total moving SNG-1-carrying vesicles co-transporting RAB-3 in WT, lrk-1(km17), and apb-3(ok429) from kymograph analysis of sequential dual color imaging at 1.3 frames per second (fps). # P-value ≤ 0.05 (One-Way ANOVA with Tukey’s post-hoc test, all comparisons to WT); ns: not significant; Number of animals (N) ≥ 15 per genotype; number of vesicles analyzed per genotype (n) > 800. (B) Quantitation of fraction of total moving SNG-1-carrying vesicles co-transporting CTNS-1 in WT, lrk-1(km17), lrk-1(km41), apb-3(ok429) and lrk-1(km17) apb-3(ok429), from kymograph analysis of sequential dual color imaging at 1.3 fps. # P-value ≤ 0.05 (Mann–Whitney Test); N ≥ 15 per genotype; n > 500. (C) Quantitation of fraction of total moving SNG-1-carrying vesicles co-transporting RAB-7 from WT, lrk-1(km17), apb-3(ok429) and lrk-1(km17) apb-3(ok429), kymograph analysis of dual color imaging. # P-value ≤ 0.05 (One-Way ANOVA with Tukey’s post-hoc test, all comparisons to WT); ns: not significant; N ≥ 20 per genotype; n > 800. (D) CTNS-1::mCherry in the cell body, process, and synapses of PLM neurons of WT, lrk-1(km17), apb-3(ok429), and lrk-1(km17) apb-3(ok429). Scale bar: 10 μm. Red arrows point to some CTNS-1-labeled compartments. (E) mScarlet::RAB-7 in the cell body, process, and synapses of PLM neurons of WT, lrk-1(km17), apb-3(ok429), and lrk-1(km17) apb-3(ok429). Scale bar: 10 μm. Red arrows point to some RAB-7-labeled compartments. (F) LMP-1::mNeonGreen in the cell body, process, and synapses of PLM neurons of WT, lrk-1(km17), apb-3(ok429), and lrk-1(km17) apb-3(ok429). Scale bar: 10 μm. Red arrows point to some RAB-7-labeled compartments. (G) Images show APB-3::GFP puncta in the head ganglion cell bodies of WT, lrk-1(km17), and syd-2(ok217). Scale bar: 10 μm. Red boxes highlight the regions of insets with cell bodies from images show APB-3::GFP in (i) WT, (ii) lrk-1, and (iii) syd-2. (H) Quantitation of the number of APB-3::GFP puncta per cell body in WT, lrk-1(km17), and syd-2(ok217). # P-value ≤ 0.05 (Mann–Whitney Test); ns: not significant; N > 10 animals; n > 75 cell bodies. (I) Quantitation of intensity of APB-3::GFP puncta in cell bodies of WT, lrk-1(km17), and syd-2(ok217). The ratio of the intensity of APB-3::GFP puncta to cytosolic intensity in the cell body is plotted. # P-value ≤ 0.05 (Mann–Whitney Test); ns: not significant; N > 10 animals; n > 75 cell bodies. (J) Quantitation of average size of APB-3::GFP puncta per cell body in WT, lrk-1(km17), and syd-2(ok217). # P-value ≤ 0.05 (Mann–Whitney Test); ns: not significant; N > 10 animals; n > 75 cell bodies.

