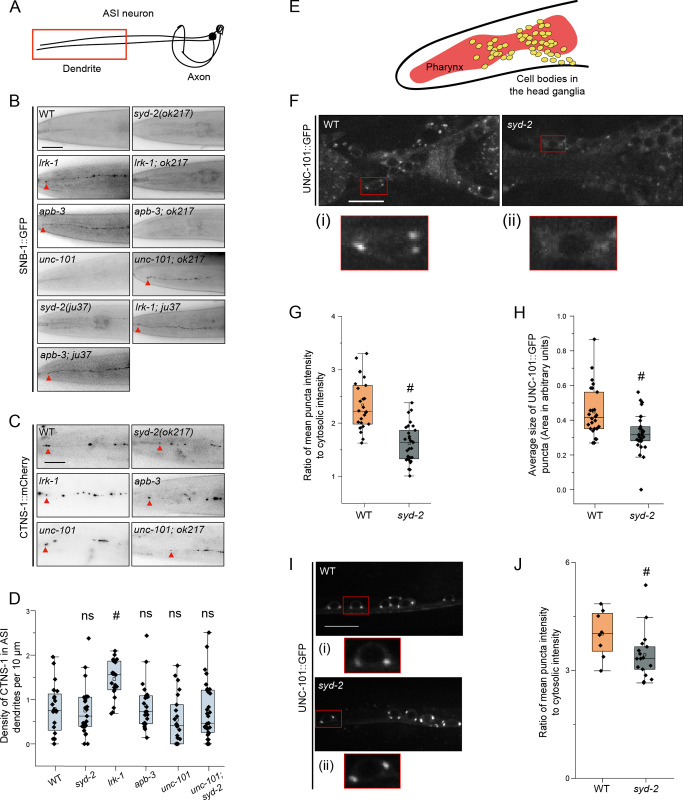
Fig 6. SYD-2 and the AP-1 complex together regulate the polarized distribution of SVps to axons.
(A) Schematic of the ASI chemosensory neuron. Red box highlights the region of imaging. (B) SNB-1::GFP in the dendrite of the ASI neuron of WT and two alleles of syd-2 and their doubles with lrk-1(km17) and apb-3(ok429). ok217 represents syd-2(ok217) allele. ju37 represents syd-2(ju37) allele. unc-101(m1) is a substitution mutation in the μ chain of the AP-1 complex causing a premature stop. Red arrows point to the SNB-1::GFP signal at the dendrite tip. Scale bar: 20 μm. Number of animals (N) > 6 per all single mutant genotypes; N > 20 for all double mutant genotypes. (C) CTNS-1::mCherry in the dendrite of the ASI neurons of WT, syd-2(ok217), lrk-1(km17), apb-3(ok429), unc-101(m1), and unc-101(m1); syd-2(ok217). Red arrows point to CTNS-1 compartments in the dendrite. Scale bar: 20 μm. N > 20 per genotype. (D) Density (number of CTNS-1 puncta per 10 μm in the ASI dendrite) of CTNS-1 in the ASI dendrite. # P-values ≤ 0.05 (Mann–Whitney Test, black comparisons against WT and blue comparisons against lrk-1); N > 20 for each genotype. (E) Schematic of C. elegans head shows the pharynx (red) and the head ganglion cell bodies (yellow). (F) Images show UNC-101::GFP puncta in the head ganglion cell bodies of WT and syd-2(ok217). Scale bar: 10 μm. The red boxes highlight the regions of insets with cell bodies from images show UNC-101::GFP in (i) WT and (ii) syd-2. (G) Quantitation of intensity of UNC-101::GFP puncta in the head ganglion cell bodies in WT and syd-2(ok217). The ratio of the intensity of UNC-101::GFP puncta to cytosolic intensity in the cell body is plotted. # P-value ≤ 0.05 (One-Way ANOVA with Tukey’s post-hoc test); N > 5 animals; n > 25 cell bodies. (H) Quantitation of average size of UNC-101::GFP puncta per cell body in WT and syd-2(ok217). # P-value ≤ 0.05 (Mann–Whitney Test); N > 5 animals; n > 25 cell bodies. (I) Images show UNC-101::GFP puncta in the cell bodies of the ventral nerve cord neurons in WT and syd-2(ok217). Scale bar: 10 μm. The red boxes highlight the regions of insets with cell bodies from images show UNC-101::GFP in (i) WT and (ii) syd-2. (J) Quantitation of intensity of UNC-101::GFP puncta in the cell bodies of the ventral nerve cord in WT and syd-2(ok217). The ratio of the intensity of UNC-101::GFP puncta to cytosolic intensity in the cell body is plotted. # P-value ≤ 0.05 (Mann–Whitney test); N > 5 animals; n > 10 cell bodies.

