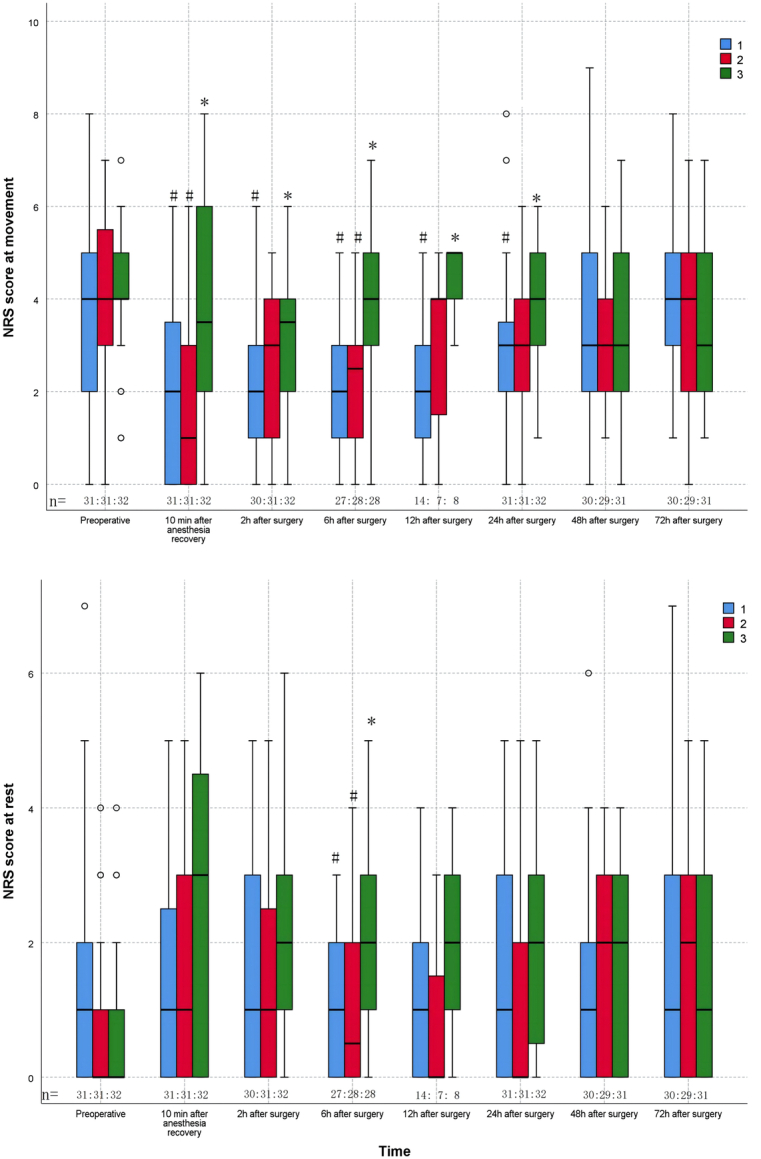
FIGURE 3.

The NRS scores. Boxplot represents the median with the 25th/75th percentile. Whiskers reveal the minimum/maximum values, Points represent the outliers. 1-FNB; 2-FTB; 3-ACB.*P<0.05 between the FNB and the other groups in the post hoc analysis; # P<0.05 between the ACB and the other groups in the post hoc analysis. ACB indicates adductor canal block; FNB, femoral nerve block; FTB, femoral triangle block; NRS, numeric rating scale.
