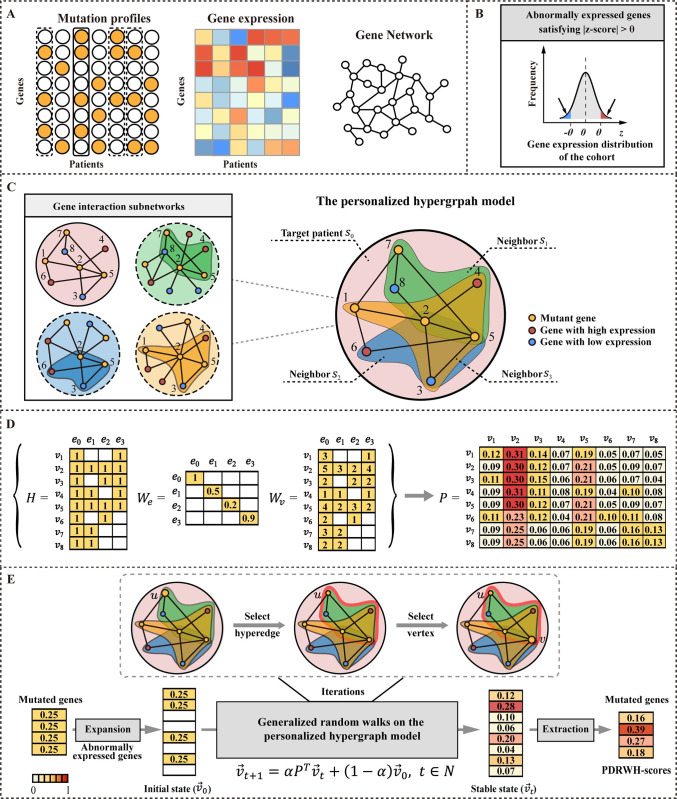
Fig 1. Overview of PDRWH for prioritizing personalized cancer driver genes.
(A) Model input. i) The somatic mutation profiles from the TCGA; ii) The gene expression data of patients; iii) Gene interaction network. (B) Pro-processing the gene expression profiles and determining the abnormally expressed genes for each sample. (C) Construction of a hypergraph model for each patient. In this model, each hyperedge represents a patient and the vertices incident to each hyperedge represent the mutated genes and abnormally expressed genes in the corresponding patient. (D) Computing the transition probability matrix of the random walks on the weighted hypergraph. (E) The process of generating PDRWH-scores through random walks on the personalized hypergraph.

