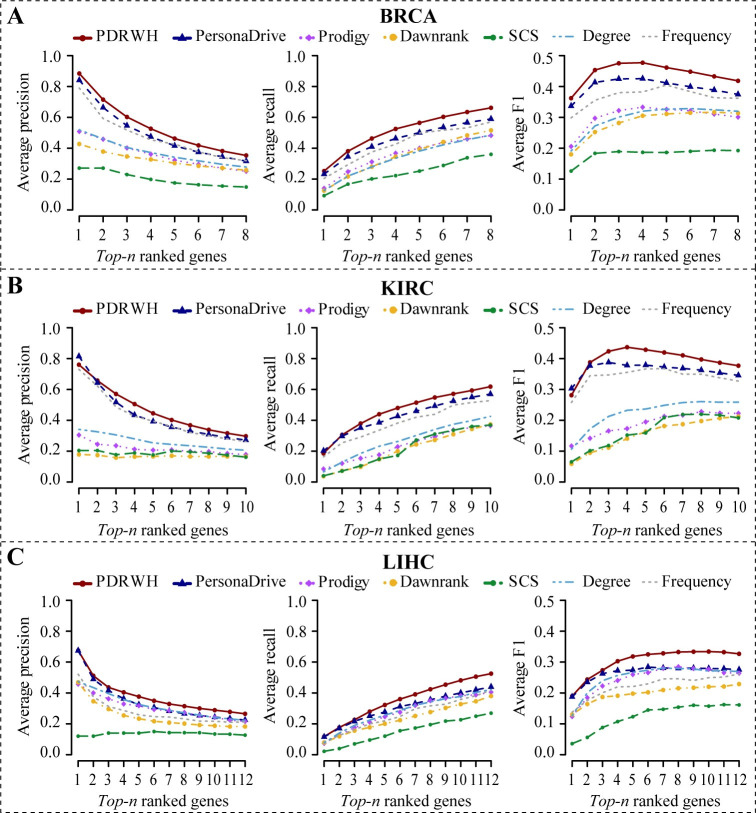
Fig 2. Comparison of the PDRWH with the other personalized prediction methods.
The average precision, recall, and F1-score for (A) the BRCA dataset, (B) the KIRC dataset, and (C) the LIHC dataset, are plotted as a function of the number of top-n ranked genes involved in the calculation of the scores. The general driver gene list is used as the reference set.

