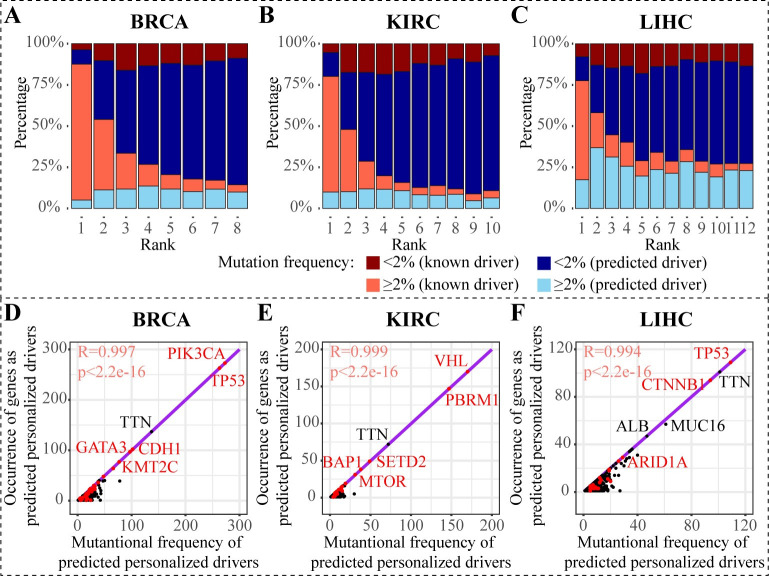
Fig 5. PDRWH identifies both common and rare drivers.
(A-C) Distribution of mutation frequency of top genes predicted by PDRWH. The i-th column in the plot represents the distribution of mutation frequency of the genes which ranked at the i-th in the predicted drivers. Each range of mutation frequency is further classified into whether the genes are known drivers in the reference set. (D-F) Scatter plots about mutation frequency of potential drivers and the occurrence of genes as predicted driver gene. Known tumor-specific driver genes are represented as red dots and others are represented as black dots. Purple lines constructed by known tumor-specific driver genes are the regression lines.

