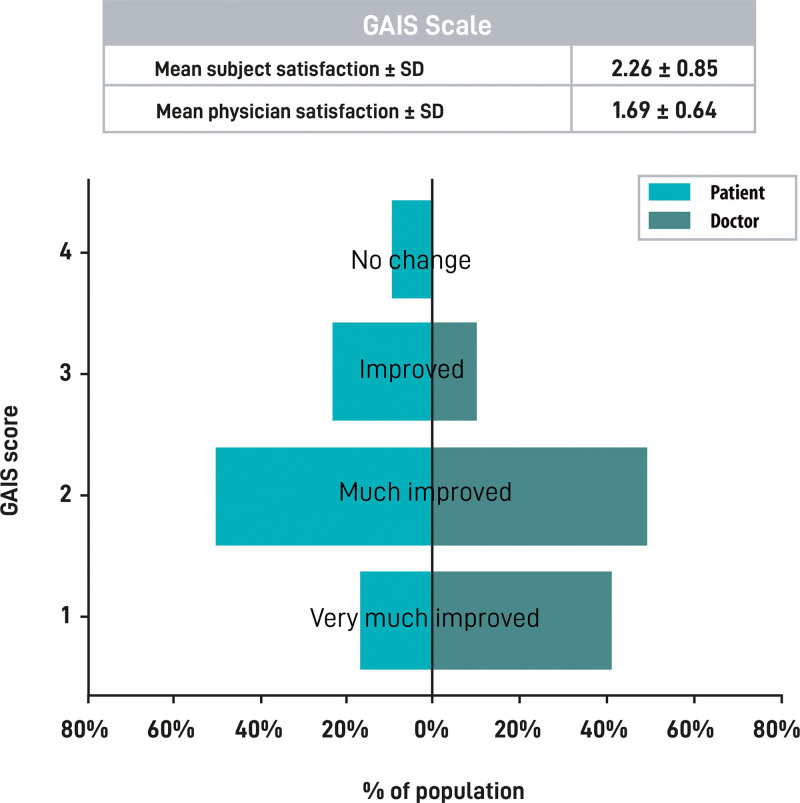
Fig. 6.
Treatment satisfaction. The table at the top of the figure represents the mean and SD of the participants’ and investigators’ GAIS scores. Score results were obtained from investigators and participants after completion of GAIS questionnaire after the procedure. Histogram represents the percentage of cases that assigned each GAIS score. Participants’ and investigators’ scores are shown in light green and dark green bars, respectively. GAIS, Global Aesthetic Improvement Scale.

